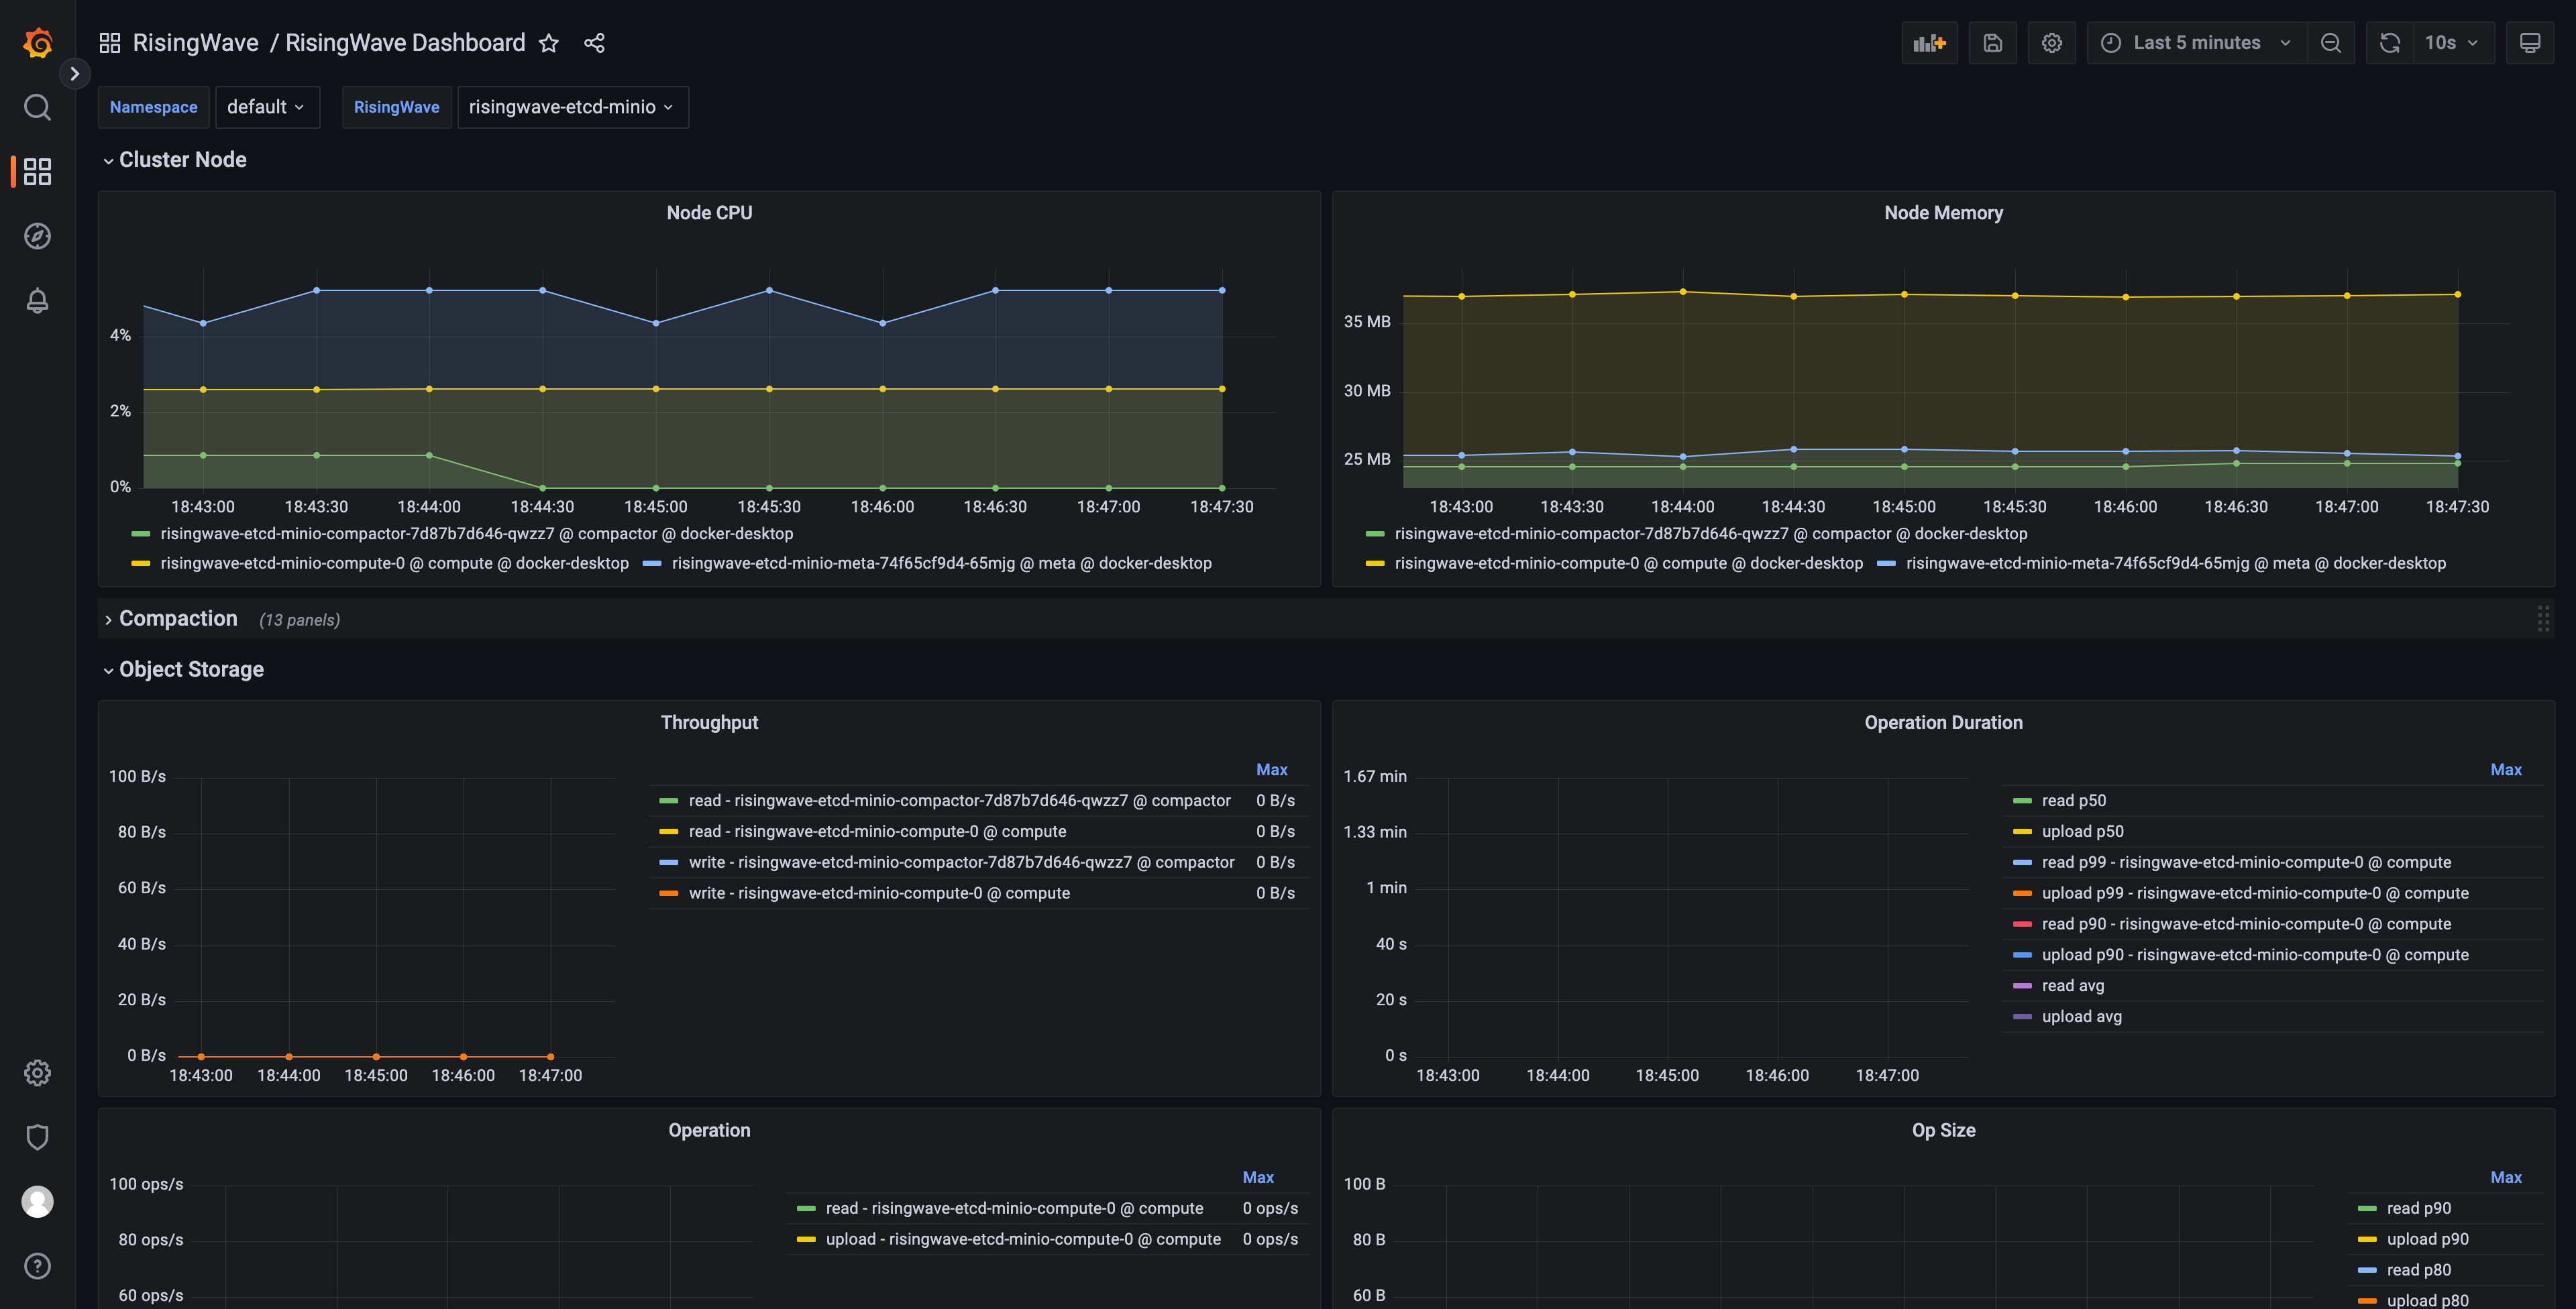
You can monitor your RisingWave cluster using multiple approaches:Documentation Index
Fetch the complete documentation index at: https://docs.risingwave.com/llms.txt
Use this file to discover all available pages before exploring further.
- Built-in RisingWave Dashboard: Web UI served by the meta node at port 5691 (by default), providing cluster overview, catalog inspection, and fragment graphs. See Troubleshooting Overview - Dashboard for details.
- Prometheus + Grafana: For detailed performance metrics and alerting. RisingWave exposes Prometheus metrics endpoints on each component (compute, meta, frontend, compactor). This page describes how to set up the Prometheus/Grafana monitoring stack.
- RisingWave Console (separate product): An enhanced on-premise UI with additional features like risectl command execution, automated diagnostics, and metadata snapshot management. See RisingWave Console documentation for details.
Monitoring with Prometheus and Grafana
To monitor a RisingWave cluster, you can use the monitoring stack in theRisingWave-Operator repository. The stack includes Prometheus for collecting data, Grafana for visualization and alerting, and other necessary resources.
Clone or download the RisingWave-Operator repository to your environment.
monitoring namespace and deploy all monitoring services in the namespace.
Start monitoring
The RisingWave operator is now integrated with the Prometheus operator, which creates a service monitor for RisingWave and ensures that data is collected automatically.- Check if Prometheus is collecting data from RisingWave:
- Forward the web port of Grafana to localhost.
--address 0.0.0.0 to the command to allow Grafana to accept requests from external hosts. The complete command is:
- Go to http://localhost:3000 if you access Grafana from a local machine, or
http://<client_address>:3000if you access Grafana from a different host, where<client_address>is the IP address of the machine running the Grafana service. When prompted, enter the default credentials (username:admin; password:prom-operator). - From Dashboards, select RisingWave -> risingwave_dev_dashboard. You can edit metrics in the dashboard and add new metrics.

Generate a Grafana dashboard for multiple RisingWave clusters
This section explains how to generate a Grafana dashboard for monitoring multiple RisingWave clusters deployed within a Kubernetes environment. These steps only generate the dashboard’s JSON model and can be performed on any machine with the necessary tools.We recommend using
risingwave_dev_dashboard for monitoring — it is more comprehensive and better organized than risingwave_dashboard. Note that generate.sh produces both risingwave-dev-dashboard.gen.json and risingwave-user-dashboard.gen.json using the same DASHBOARD_UID; to avoid UID collisions on import, import only risingwave-dev-dashboard.gen.json.- Clone the risingwave repository:
- Follow the instructions in the RisingWave Grafana directory README to configure the required toolchain.
- Generate the Grafana dashboard JSON model. Execute the following command to create the Grafana dashboard JSON model, enabling multi-cluster support:
-
DASHBOARD_NAMESPACE_FILTER_ENABLED=true: Enables filtering by Kubernetes namespace. -
DASHBOARD_RISINGWAVE_NAME_FILTER_ENABLED=true: Enables filtering by RisingWave cluster name. -
DASHBOARD_DYNAMIC_SOURCE=true: Enables dynamic selection of the data source in Grafana. -
DASHBOARD_UID=risingwave_dev_dashboard: Sets the unique identifier (UID) for the dashboard.
- Import the generated JSON models (with the extension
.gen.json) into your Grafana instance.
Troubleshooting
Namespace filter not working
If the namespace filter in your Grafana dashboard is not functioning correctly, the issue may stem from the absence of therisingwave_name label in your collected metrics. To resolve this, you can use the metricRelabelings and relabelings fields in the Prometheus Operator endpoint spec to append this label to your metrics.