> ## Documentation Index
> Fetch the complete documentation index at: https://docs.risingwave.com/llms.txt
> Use this file to discover all available pages before exploring further.
# Built-in UI
> The built-in UI ships with every RisingWave cluster. It runs on the meta node and lets you inspect catalog objects, streaming fragment graphs, and debug information without installing anything else.
The **built-in UI** is the web UI that ships with every RisingWave deployment. It is served directly by the meta node — there is nothing extra to install. Internally it is also referred to as the *RisingWave Dashboard* (for example, in the `--dashboard-host` flag and the `RW_DASHBOARD_HOST` environment variable). If you are looking for the separate, premium operations console, see [RisingWave Console](/web-ui/introduction#risingwave-console) instead.
 ## Accessing the built-in UI
By default, the meta node serves the built-in UI on port `5691`. If you started RisingWave with an official Docker image or in standalone mode, that port is exposed automatically — open `http://localhost:5691` in your browser.
You can change the bind address with either of the following on the meta node:
* The `--dashboard-host` command-line flag.
* The `RW_DASHBOARD_HOST` environment variable.
For Kubernetes deployments, expose port `5691` on the meta node service and access the UI through your usual ingress, port-forward, or service mesh.
## What you can do from the built-in UI
The built-in UI is a read-only inspection tool. From it, you can:
* **Browse catalog objects**: sources, tables, materialized views, indexes, internal tables, sinks, views, subscriptions, and functions.
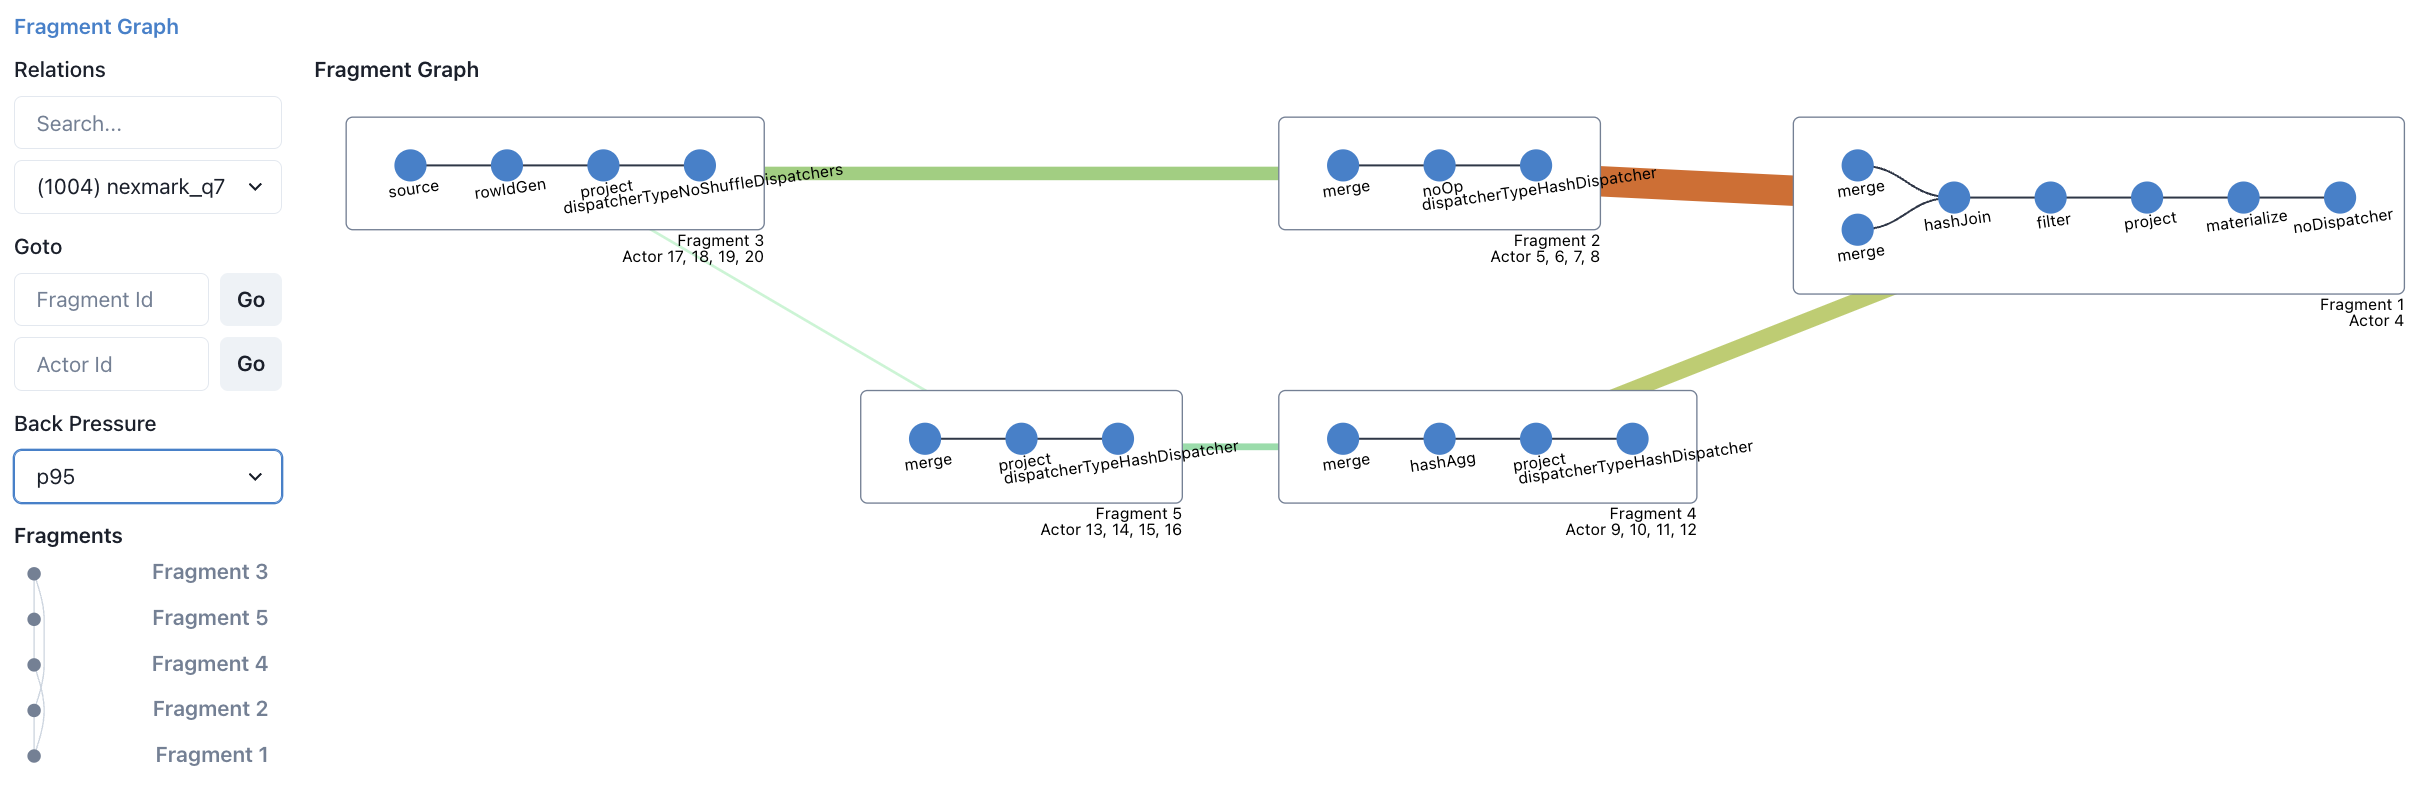
* **Visualize streaming execution** with fragment graphs that include color-coded back-pressure rates.
* **Inspect batch task execution.**
* **Debug** using await tree dumps, heap profiling, and distributed plan visualization.
* **View streaming relation graphs** and internal table structures.
For step-by-step troubleshooting workflows that use the built-in UI, see [Troubleshooting overview](/troubleshoot/overview#get-an-overview-of-the-cluster).
## Built-in UI vs. Grafana vs. RisingWave Console
The built-in UI covers cluster introspection, but it is not a metrics or alerting product. For different needs:
* For CPU, memory, network, and per-component performance metrics, use the **Prometheus + Grafana** stack. See [Monitor a RisingWave cluster](/operate/monitor-risingwave-cluster).
* For multi-cluster operations, automated metadata snapshots, diagnostic collection, and `risectl` access from a UI, use **[RisingWave Console](/web-ui/introduction#risingwave-console)** (premium).
You can use all three together — they are complementary.
## Accessing the built-in UI
By default, the meta node serves the built-in UI on port `5691`. If you started RisingWave with an official Docker image or in standalone mode, that port is exposed automatically — open `http://localhost:5691` in your browser.
You can change the bind address with either of the following on the meta node:
* The `--dashboard-host` command-line flag.
* The `RW_DASHBOARD_HOST` environment variable.
For Kubernetes deployments, expose port `5691` on the meta node service and access the UI through your usual ingress, port-forward, or service mesh.
## What you can do from the built-in UI
The built-in UI is a read-only inspection tool. From it, you can:
* **Browse catalog objects**: sources, tables, materialized views, indexes, internal tables, sinks, views, subscriptions, and functions.
* **Visualize streaming execution** with fragment graphs that include color-coded back-pressure rates.
* **Inspect batch task execution.**
* **Debug** using await tree dumps, heap profiling, and distributed plan visualization.
* **View streaming relation graphs** and internal table structures.
For step-by-step troubleshooting workflows that use the built-in UI, see [Troubleshooting overview](/troubleshoot/overview#get-an-overview-of-the-cluster).
## Built-in UI vs. Grafana vs. RisingWave Console
The built-in UI covers cluster introspection, but it is not a metrics or alerting product. For different needs:
* For CPU, memory, network, and per-component performance metrics, use the **Prometheus + Grafana** stack. See [Monitor a RisingWave cluster](/operate/monitor-risingwave-cluster).
* For multi-cluster operations, automated metadata snapshots, diagnostic collection, and `risectl` access from a UI, use **[RisingWave Console](/web-ui/introduction#risingwave-console)** (premium).
You can use all three together — they are complementary.