> ## Documentation Index
> Fetch the complete documentation index at: https://docs.risingwave.com/llms.txt
> Use this file to discover all available pages before exploring further.
# Overview
> This guide assumes that you deploy RisingWave on K8s using the RisingWave K8s Operator. In the Operator, we packaged RisingWave, RisingWave Dashboard, and third-party observability and logging tools like Prometheus and Grafana.
## Monitor your cluster
### Get an overview of the cluster
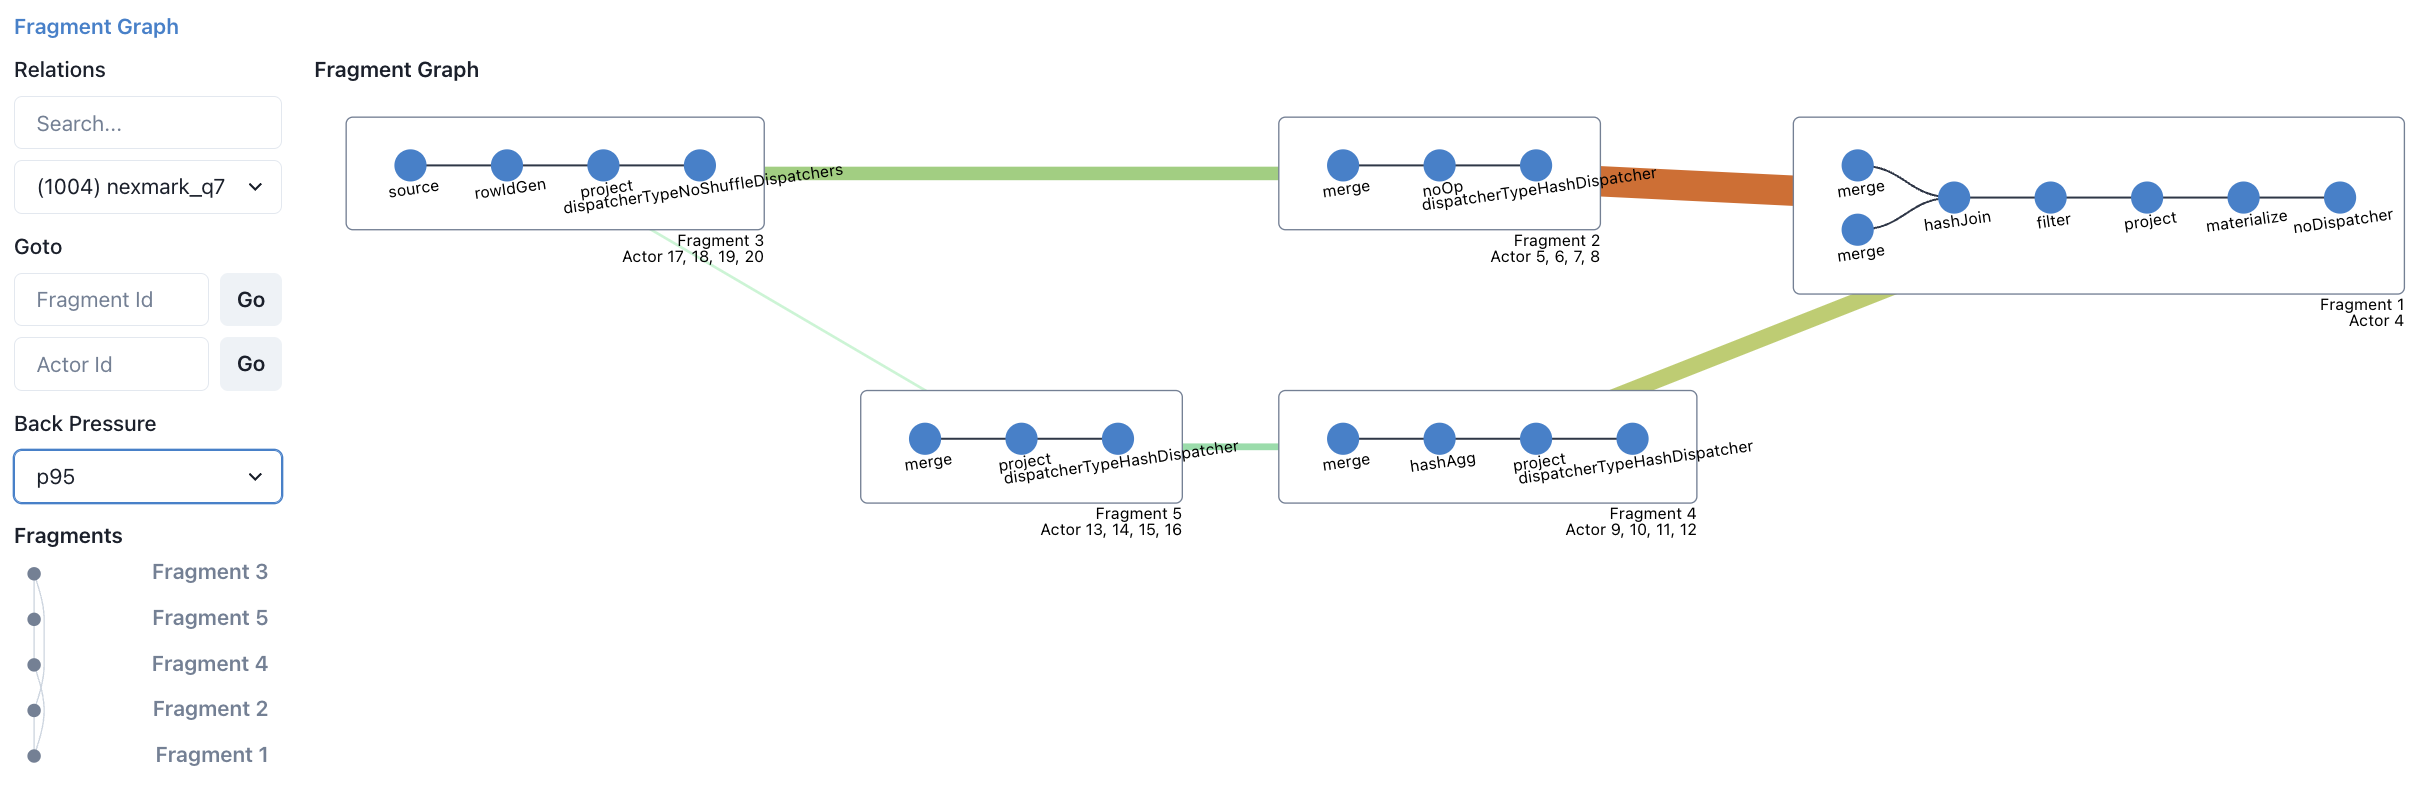
RisingWave Dashboard is the built-in web UI of RisingWave, implemented as a Next.js application. From RisingWave Dashboard, you can:
* View catalog objects: sources, tables, materialized views, indexes, internal tables, sinks, views, subscriptions, and functions
* Monitor streaming execution with fragment graphs showing back-pressure rates (color-coded visualization)
* Inspect batch task execution
* Debug with await tree dumps, heap profiling, and distributed plan visualization
* View streaming relation graphs and internal table structures
**Accessing the Dashboard**
By default, the dashboard is served by the meta node at `http://localhost:5691`. The meta node serves the dashboard as static HTML files (built from the Next.js source). You can configure the dashboard address via the `--dashboard-host` flag or `RW_DASHBOARD_HOST` environment variable when starting the meta node.
**Alternative: RisingWave Console**
For enhanced monitoring and troubleshooting capabilities, you can also use the [RisingWave Console](/web-ui/introduction), which provides diagnostic collection, automated monitoring, and a comprehensive web-based interface for cluster management and observability.
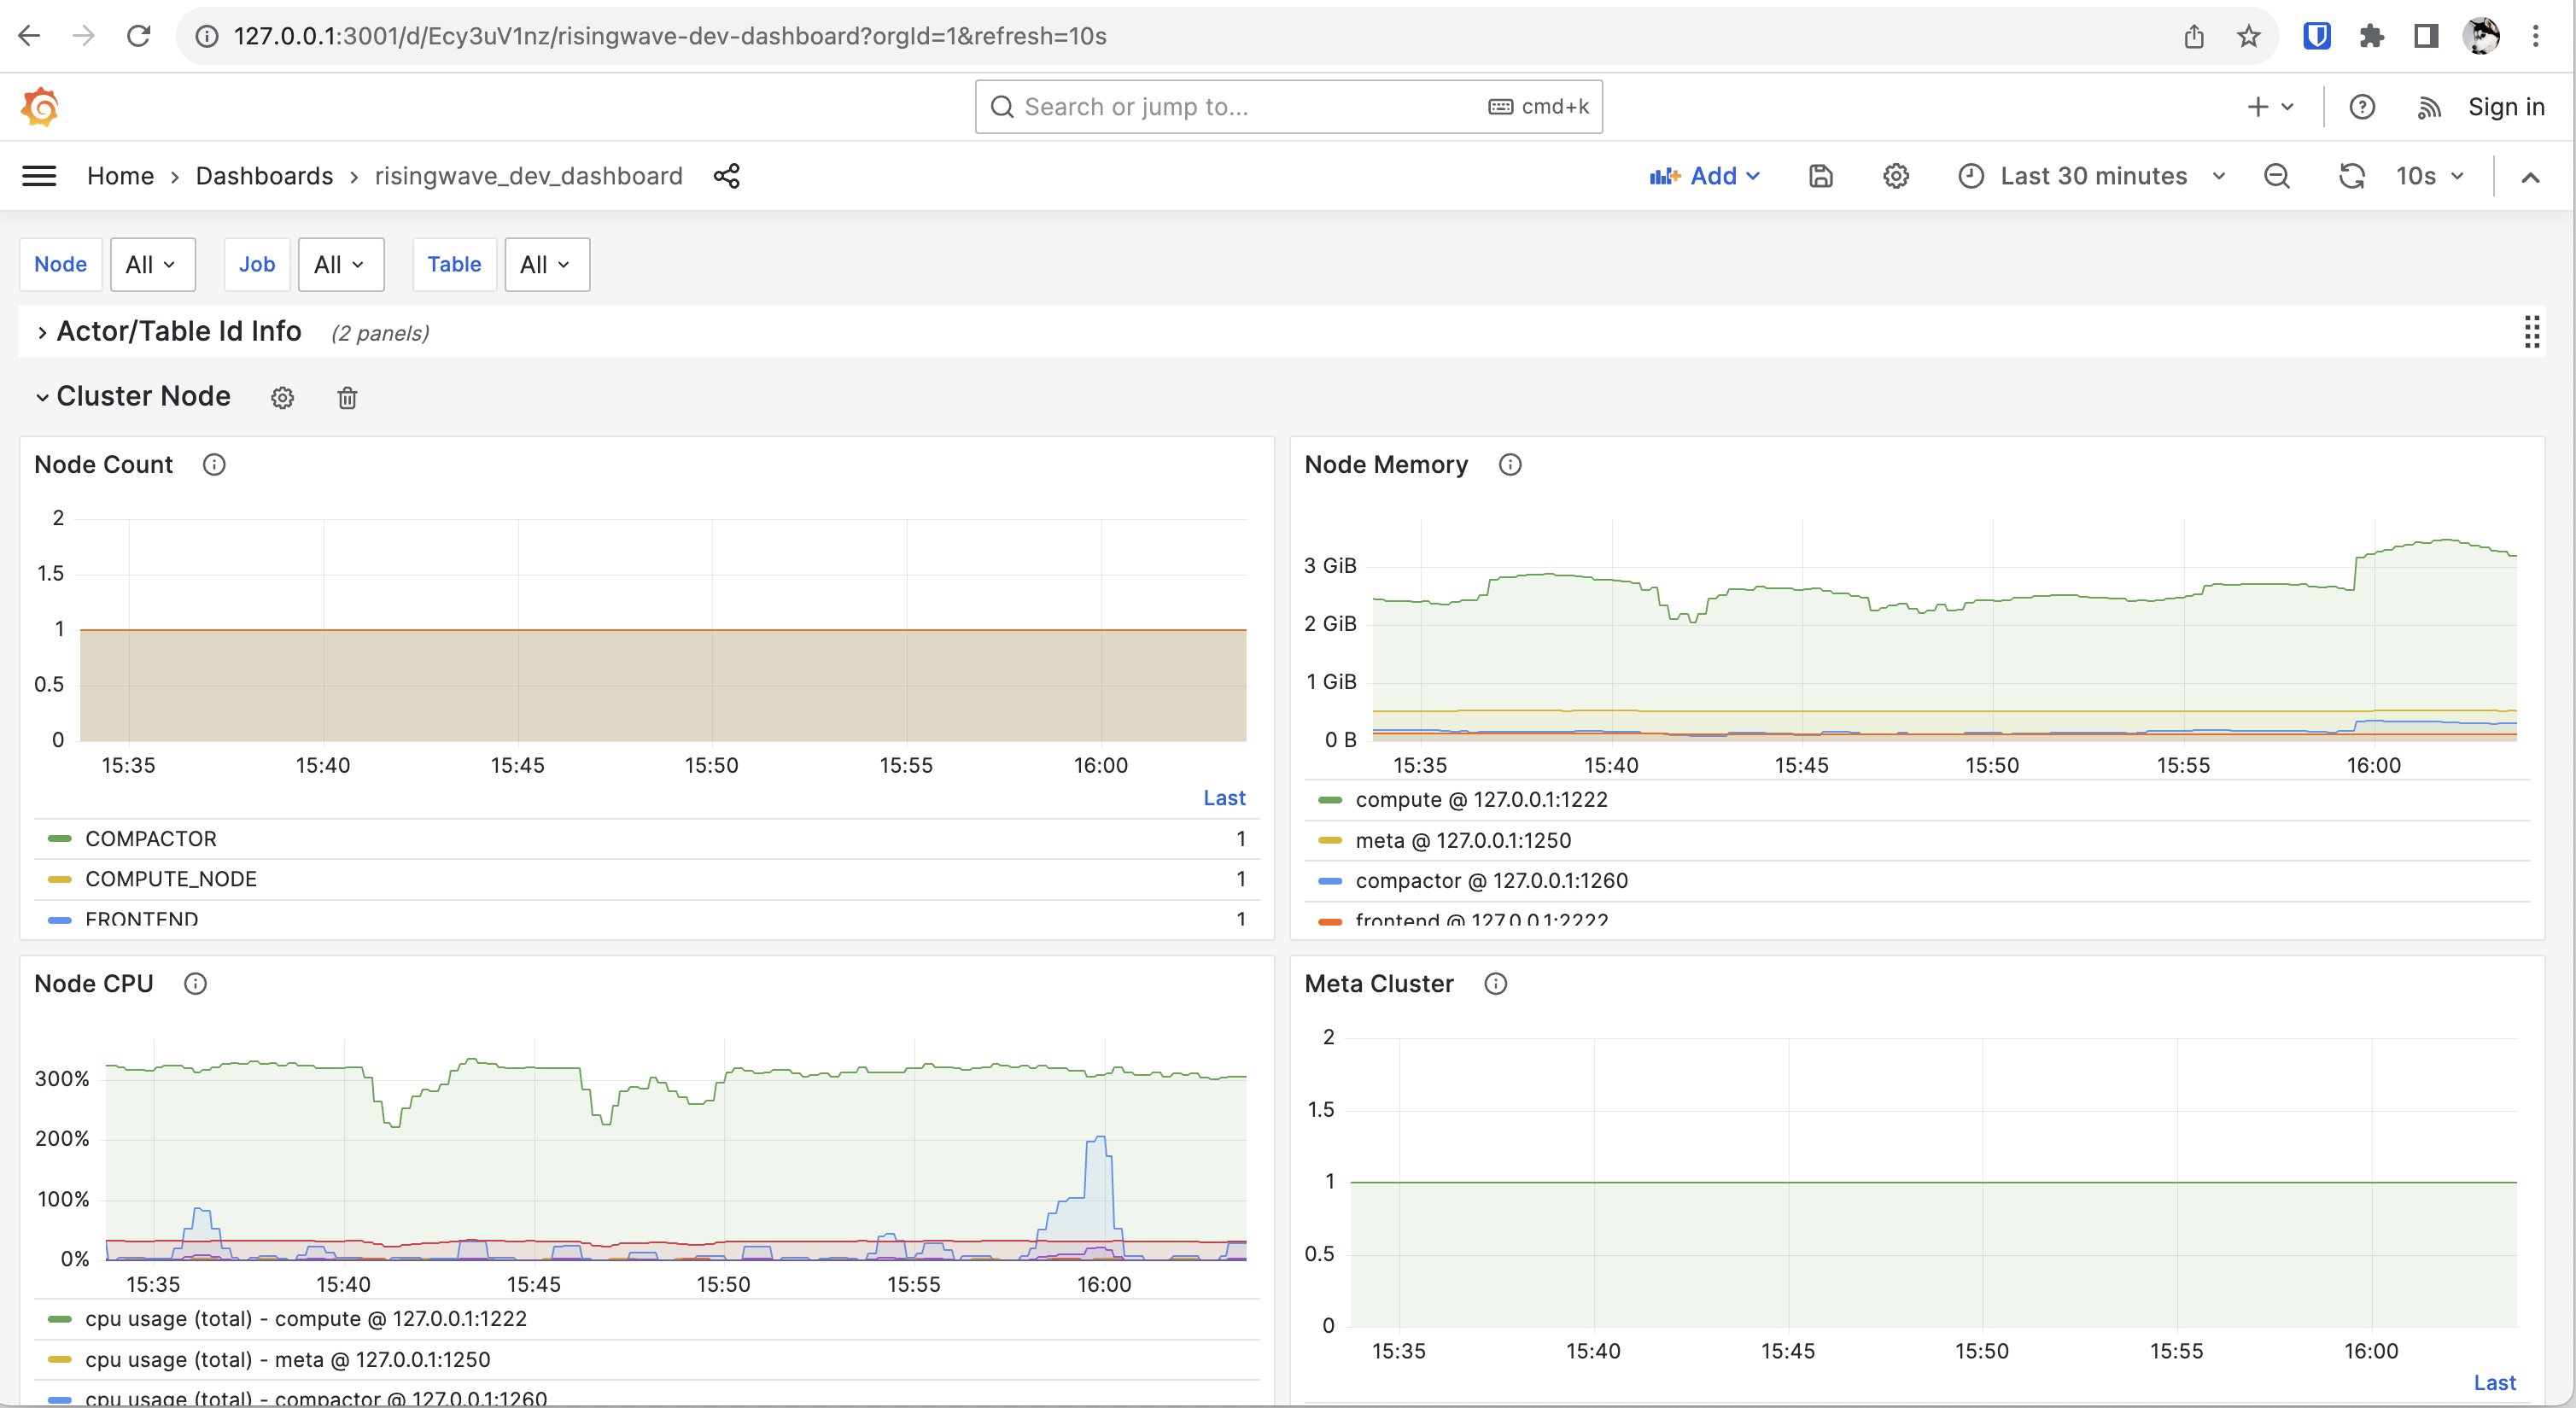
 ### View performance metrics
You can monitor the performance metrics of a RisingWave cluster, including the usage of resources like CPU, memory, and network, and the status of different nodes.
RisingWave uses Prometheus for collecting data, and Grafana for visualization and alerting. This monitoring stack requires configuration. To configure the monitoring stack, follow the steps detailed in [Monitor a RisingWave cluster](/operate/monitor-risingwave-cluster).
After you complete the configuration, go to [http://localhost:3000](http://localhost:3000) to access Grafana from a local machine, or `http://:3000` to access Grafana from a different host, where `` is the IP address of the machine running the Grafana service.
When using the Kubernetes operator deployment, the default Grafana credentials are typically `admin` / `prom-operator` (set by the prometheus-operator). If you deployed Grafana manually, consult your Grafana configuration for credentials.
There are 2 built-in dashboards in the official release.
* **risingwave\_dashboard** contains user-facing key metrics.
* **risingwave\_dev\_dashboard** contains more low-level metrics for RisingWave developers.
### View performance metrics
You can monitor the performance metrics of a RisingWave cluster, including the usage of resources like CPU, memory, and network, and the status of different nodes.
RisingWave uses Prometheus for collecting data, and Grafana for visualization and alerting. This monitoring stack requires configuration. To configure the monitoring stack, follow the steps detailed in [Monitor a RisingWave cluster](/operate/monitor-risingwave-cluster).
After you complete the configuration, go to [http://localhost:3000](http://localhost:3000) to access Grafana from a local machine, or `http://:3000` to access Grafana from a different host, where `` is the IP address of the machine running the Grafana service.
When using the Kubernetes operator deployment, the default Grafana credentials are typically `admin` / `prom-operator` (set by the prometheus-operator). If you deployed Grafana manually, consult your Grafana configuration for credentials.
There are 2 built-in dashboards in the official release.
* **risingwave\_dashboard** contains user-facing key metrics.
* **risingwave\_dev\_dashboard** contains more low-level metrics for RisingWave developers.
 ## Review error messages and logs
Generally you get an error when something goes wrong. The error message should provide some basic information about what went wrong. We are summarizing the common errors and solutions. We'll publish this summary as soon as it's ready.
The logs of RisingWave are outputted to `stdout` by default. If you are deploying RisingWave via our official Kubernetes operator, you can view them via the `kubectl logs` command.
We recommend that you deploy a dedicated logging system, such as [Grafana Loki](https://grafana.com/oss/loki/) or [Elasticsearch](https://www.elastic.co/elasticsearch).
## Leverage system catalogs
System catalogs provide comprehensive information about the definitions and metadata of objects in RisingWave. For a detailed list of system catalogs available, see [System catalogs](/sql/system-catalogs/overview).
## Support resources
The most direct way to get help is by reporting your issues in our [Slack Community workspace](https://www.risingwave.com/slack).
When reporting your issues in the Slack workspace, remember to include the logs. Including logs will help our engineers troubleshoot.
## File an issue
If you've tried to troubleshoot an issue yourself but didn't succeed, you can [file an issue in GitHub](https://github.com/risingwavelabs/risingwave/issues/new/choose).
Please include the following details in your GitHub issue:
* A summary of the issue.
* The steps to reproduce the issue.
* The result you expected.
* The result that actually occurred.
## Review error messages and logs
Generally you get an error when something goes wrong. The error message should provide some basic information about what went wrong. We are summarizing the common errors and solutions. We'll publish this summary as soon as it's ready.
The logs of RisingWave are outputted to `stdout` by default. If you are deploying RisingWave via our official Kubernetes operator, you can view them via the `kubectl logs` command.
We recommend that you deploy a dedicated logging system, such as [Grafana Loki](https://grafana.com/oss/loki/) or [Elasticsearch](https://www.elastic.co/elasticsearch).
## Leverage system catalogs
System catalogs provide comprehensive information about the definitions and metadata of objects in RisingWave. For a detailed list of system catalogs available, see [System catalogs](/sql/system-catalogs/overview).
## Support resources
The most direct way to get help is by reporting your issues in our [Slack Community workspace](https://www.risingwave.com/slack).
When reporting your issues in the Slack workspace, remember to include the logs. Including logs will help our engineers troubleshoot.
## File an issue
If you've tried to troubleshoot an issue yourself but didn't succeed, you can [file an issue in GitHub](https://github.com/risingwavelabs/risingwave/issues/new/choose).
Please include the following details in your GitHub issue:
* A summary of the issue.
* The steps to reproduce the issue.
* The result you expected.
* The result that actually occurred.