> ## Documentation Index
> Fetch the complete documentation index at: https://docs.risingwave.com/llms.txt
> Use this file to discover all available pages before exploring further.
# Specific bottlenecks
> Identify and resolve specific resource bottlenecks in RisingWave, including CPU, memory, storage, and more.
This topic provides detailed guidance on diagnosing and addressing specific resource bottlenecks that can cause high latency and slow stream processing in RisingWave. If the [General troubleshooting approach](/performance/performance-troubleshoot-ov) and the [High latency](/performance/troubleshoot-high-latency) troubleshooting guide have pointed you towards a potential resource limitation, this section will help you confirm the issue and find solutions.
## CPU bottleneck
If you suspect that insufficient CPU resources are causing high latency, examine the following metrics and consider the recommended actions.
In your Grafana dashboard (dev), navigate to **Cluster Node** > **Node CPU panel**, and locate the **cpu usage (avg per core) - compute** metric:
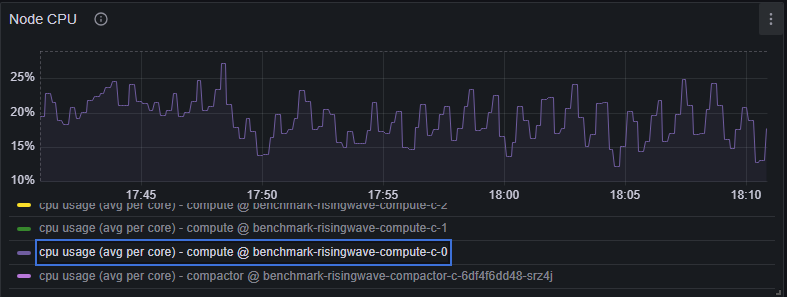 *Figure 1: CPU usage panel in Grafana.*
**Indicators:**
* CPU usage (avg per core) consistently exceeds 80%. See [Resource utilization](/performance/metrics#resource-utilization).
**Actions:**
* Consider scaling up (adding more cores to a Streaming Node) or scaling out (adding more Streaming Nodes to the cluster). See [Resource allocation](/performance/best-practices#resource-allocation).
**Caveats:**
* Low CPU usage *doesn't* necessarily mean you can scale down. If the bottleneck is caused by slow state reads/updates due to insufficient memory, shrinking Compute Nodes might worsen the situation.
* High memory usage is expected in RisingWave, as it utilizes available memory for caching. For details, see [Why is the memory usage so high?](/faq/faq-using-risingwave#why-the-memory-usage-is-so-high).
## State access bottleneck (read)
Slow state access can significantly impact performance. This section helps you diagnose issues related to reading state data from the executor cache, storage, and storage cache. If you suspect issues with state access, start by checking [Cache performance](/performance/metrics#cache-performance).
### Executor cache
In your Grafana dashboard (dev), navigate to **Streaming Actors** > **Executor Cache Memory Usage** panel.
*Figure 1: CPU usage panel in Grafana.*
**Indicators:**
* CPU usage (avg per core) consistently exceeds 80%. See [Resource utilization](/performance/metrics#resource-utilization).
**Actions:**
* Consider scaling up (adding more cores to a Streaming Node) or scaling out (adding more Streaming Nodes to the cluster). See [Resource allocation](/performance/best-practices#resource-allocation).
**Caveats:**
* Low CPU usage *doesn't* necessarily mean you can scale down. If the bottleneck is caused by slow state reads/updates due to insufficient memory, shrinking Compute Nodes might worsen the situation.
* High memory usage is expected in RisingWave, as it utilizes available memory for caching. For details, see [Why is the memory usage so high?](/faq/faq-using-risingwave#why-the-memory-usage-is-so-high).
## State access bottleneck (read)
Slow state access can significantly impact performance. This section helps you diagnose issues related to reading state data from the executor cache, storage, and storage cache. If you suspect issues with state access, start by checking [Cache performance](/performance/metrics#cache-performance).
### Executor cache
In your Grafana dashboard (dev), navigate to **Streaming Actors** > **Executor Cache Memory Usage** panel.
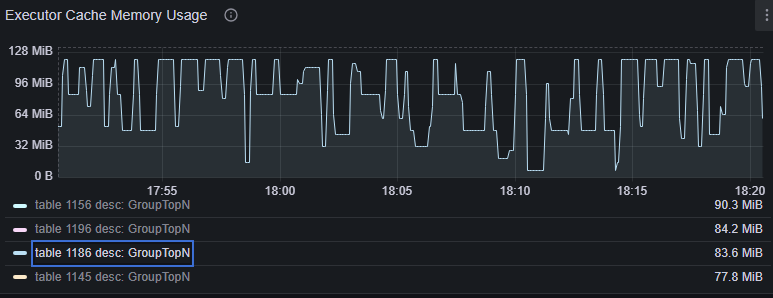 *Figure 2: Executor cache memory usage in Grafana.*
And navigate to the **Streaming Actors** > **Executor Cache Miss Ratio** panel:
*Figure 2: Executor cache memory usage in Grafana.*
And navigate to the **Streaming Actors** > **Executor Cache Miss Ratio** panel:
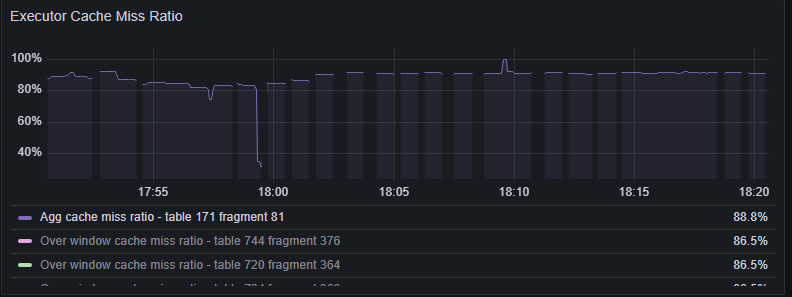 *Figure 3: Executor cache miss ratio in Grafana.*
**Indicators:**
* Executor memory usage is significantly smaller than expected for the workload.
* High executor cache miss ratio.
**Actions:**
* Increase Streaming Node memory by scaling up or scaling out. See [Resource allocation](/performance/best-practices#resource-allocation).
### Storage read
You can use the Grafana dashboard (dev) > **Actor/Table Id Info** > **State Table Info** to check the table name, table type, and the associated materialized view and fragment ID of a state table. You can infer the executor type by looking at the `table_name`.
*Figure 3: Executor cache miss ratio in Grafana.*
**Indicators:**
* Executor memory usage is significantly smaller than expected for the workload.
* High executor cache miss ratio.
**Actions:**
* Increase Streaming Node memory by scaling up or scaling out. See [Resource allocation](/performance/best-practices#resource-allocation).
### Storage read
You can use the Grafana dashboard (dev) > **Actor/Table Id Info** > **State Table Info** to check the table name, table type, and the associated materialized view and fragment ID of a state table. You can infer the executor type by looking at the `table_name`.
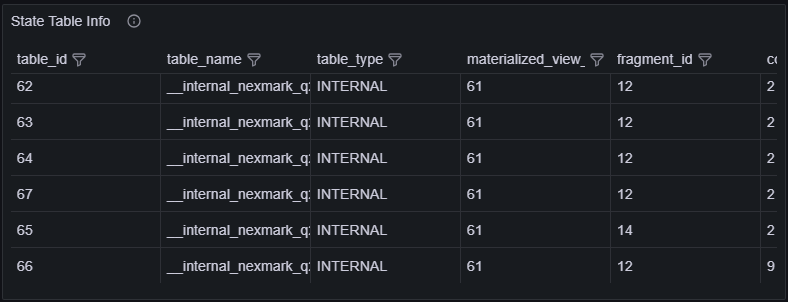 *Figure 4: State table info in Grafana.*
You can use the "Table" filter at the top of the Grafana page to choose metrics specific to `table_id(s)` shown in the storage metrics.
Example:
*Figure 4: State table info in Grafana.*
You can use the "Table" filter at the top of the Grafana page to choose metrics specific to `table_id(s)` shown in the storage metrics.
Example:
 *Figure 5: Using the "Table" filter in Grafana.*
When there is an executor cache miss, state reads are handled by the storage layer. There are two types of storage reads:
* **`Get`:** Used for point lookups (e.g., by `HashAgg` executors).
* **`Iter`:** Used for range/prefix scans (e.g., by `HashJoin` executors).
#### Get operations
Navigate to Grafana dashboard (dev) > **Hummock (Read)** > **Read Duration (Get)**
*Figure 5: Using the "Table" filter in Grafana.*
When there is an executor cache miss, state reads are handled by the storage layer. There are two types of storage reads:
* **`Get`:** Used for point lookups (e.g., by `HashAgg` executors).
* **`Iter`:** Used for range/prefix scans (e.g., by `HashJoin` executors).
#### Get operations
Navigate to Grafana dashboard (dev) > **Hummock (Read)** > **Read Duration (Get)**
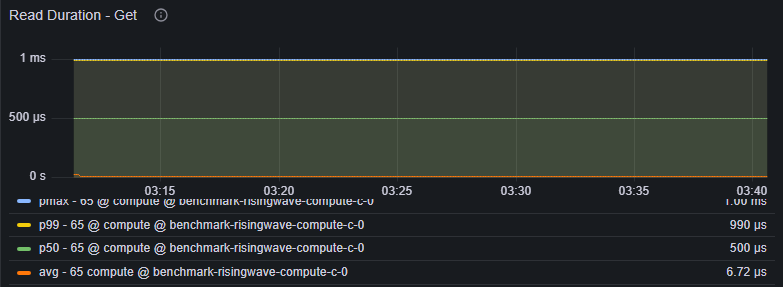 *Figure 6: Read duration (Get) in Grafana.*
The "Read Duration - (Get)" panel shows a histogram of `Get` durations for each state table.
**Indicators:**
* `avg` / `p99` duration consistently 10-100ms or higher.
**Actions:**
* Investigate potential storage cache issues (see below).
#### Iter operations
Navigate to Grafana dashboard (dev) > **Hummock (Read)** > **Read Duration (Iter)**
*Figure 6: Read duration (Get) in Grafana.*
The "Read Duration - (Get)" panel shows a histogram of `Get` durations for each state table.
**Indicators:**
* `avg` / `p99` duration consistently 10-100ms or higher.
**Actions:**
* Investigate potential storage cache issues (see below).
#### Iter operations
Navigate to Grafana dashboard (dev) > **Hummock (Read)** > **Read Duration (Iter)**
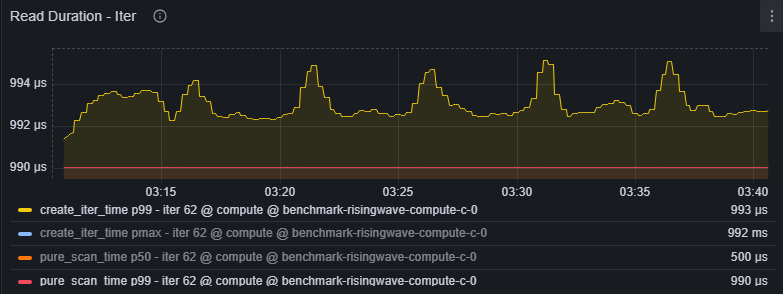 *Figure 7: Read duration (Iter) in Grafana.*
The "Read Duration - (Iter)" panel shows a histogram of `Iter` durations, divided into:
* `create_iter_time`: Time to initialize the storage iterator (fetching metadata, pruning files, initial seek).
* `pure_scan_time`: Time spent scanning data within the iterator.
**Indicators:**
* `p99` duration consistently 10-100ms or higher.
**Actions:**
* Check for excessive tombstones or stale keys (see below).
* Investigate potential storage cache issues (see below).
#### Tombstones and stale keys
Navigate to Grafana dashboard (dev) > **Hummock (Read)** > **Iter Keys flow**
*Figure 7: Read duration (Iter) in Grafana.*
The "Read Duration - (Iter)" panel shows a histogram of `Iter` durations, divided into:
* `create_iter_time`: Time to initialize the storage iterator (fetching metadata, pruning files, initial seek).
* `pure_scan_time`: Time spent scanning data within the iterator.
**Indicators:**
* `p99` duration consistently 10-100ms or higher.
**Actions:**
* Check for excessive tombstones or stale keys (see below).
* Investigate potential storage cache issues (see below).
#### Tombstones and stale keys
Navigate to Grafana dashboard (dev) > **Hummock (Read)** > **Iter Keys flow**
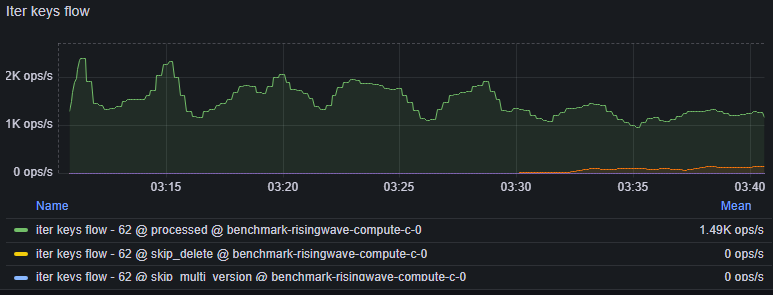 *Figure 8: Iter keys flow in Grafana.*
The "Iter keys flow" panel tracks the operations per second (OPS) of different key types:
* `processed`: Visible keys processed.
* `skip_delete`: Tombstone keys encountered (marked for deletion).
* `skip_multi_version`: Stale keys encountered (older versions of data).
**Indicators:**
* High `skip_delete` and `skip_multi_version` values indicate that the compaction process is lagging.
**Actions:**
* Investigate potential [Compaction bottleneck](#compaction-bottleneck).
### Storage cache
RisingWave's storage engine (Hummock) uses two types of cache:
* **Block cache (data cache):** Caches blocks of data from stored files (SSTs). Each block is typically 64KB.
* **Meta cache:** Caches metadata about stored files (SSTs).
#### Block cache
Navigate to Grafana dashboard (dev) > **Hummock (Read)** > **Cache Size**.
*Figure 8: Iter keys flow in Grafana.*
The "Iter keys flow" panel tracks the operations per second (OPS) of different key types:
* `processed`: Visible keys processed.
* `skip_delete`: Tombstone keys encountered (marked for deletion).
* `skip_multi_version`: Stale keys encountered (older versions of data).
**Indicators:**
* High `skip_delete` and `skip_multi_version` values indicate that the compaction process is lagging.
**Actions:**
* Investigate potential [Compaction bottleneck](#compaction-bottleneck).
### Storage cache
RisingWave's storage engine (Hummock) uses two types of cache:
* **Block cache (data cache):** Caches blocks of data from stored files (SSTs). Each block is typically 64KB.
* **Meta cache:** Caches metadata about stored files (SSTs).
#### Block cache
Navigate to Grafana dashboard (dev) > **Hummock (Read)** > **Cache Size**.
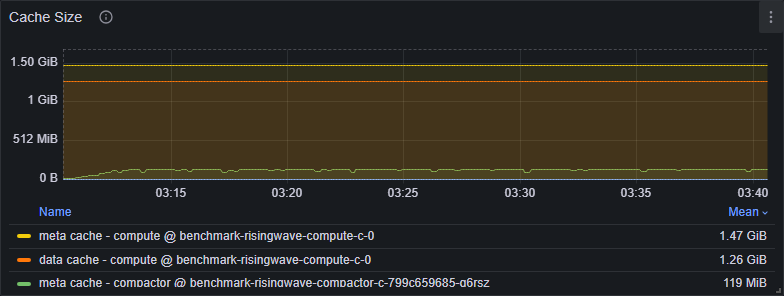 *Figure 9: Cache size in Grafana.*
Navigate to Grafana dashboard (dev) > **Hummock (Read)** > **Cache Miss Ratio**
*Figure 9: Cache size in Grafana.*
Navigate to Grafana dashboard (dev) > **Hummock (Read)** > **Cache Miss Ratio**
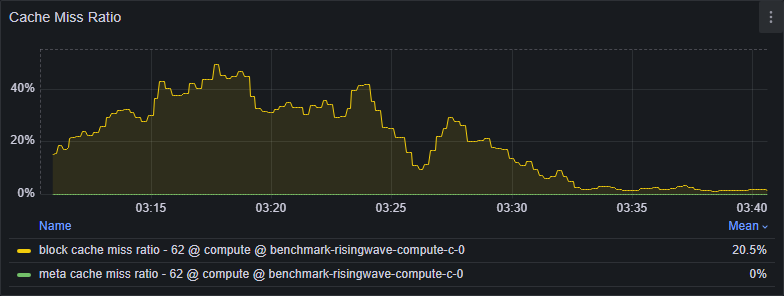 *Figure 10: Cache miss ratio in Grafana.*
**Indicators:**
* High block cache miss ratio. This is influenced by both executor state access locality (better locality = lower miss ratio) and block cache capacity (smaller capacity relative to the working set = higher miss ratio).
**Actions:**
* Scale up the Streaming Node or tune memory configurations. See [Resource allocation](/performance/best-practices#resource-allocation).
**Caveats:**
* A high miss *ratio* alone doesn't always indicate a problem. Consider the *absolute number* of misses. A low miss ratio with a very high number of total operations can still result in significant latency.
#### Meta cache
Navigate to Grafana dashboard (dev) > **Hummock (Read)** > **Cache Ops**.
*Figure 10: Cache miss ratio in Grafana.*
**Indicators:**
* High block cache miss ratio. This is influenced by both executor state access locality (better locality = lower miss ratio) and block cache capacity (smaller capacity relative to the working set = higher miss ratio).
**Actions:**
* Scale up the Streaming Node or tune memory configurations. See [Resource allocation](/performance/best-practices#resource-allocation).
**Caveats:**
* A high miss *ratio* alone doesn't always indicate a problem. Consider the *absolute number* of misses. A low miss ratio with a very high number of total operations can still result in significant latency.
#### Meta cache
Navigate to Grafana dashboard (dev) > **Hummock (Read)** > **Cache Ops**.
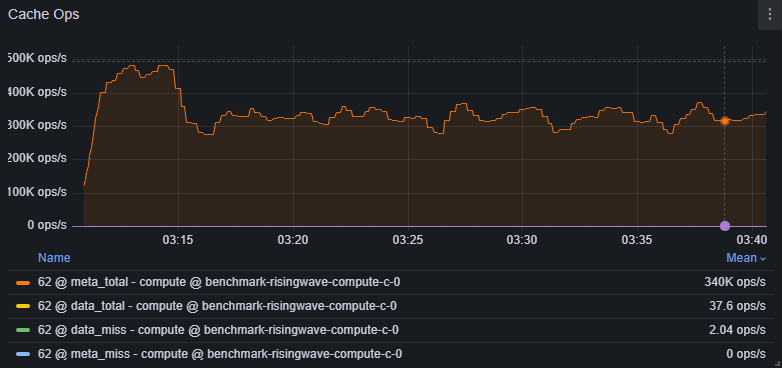 *Figure 11: Cache operations in Grafana.*
* `meta_miss`: Should ideally be close to 0%.
* `data_miss`: Represents misses that require access to the remote object store.
**Indicators:**
* `meta_miss` is non-zero.
* `data_miss` is high.
**Actions:**
* Scale up the Streaming Node or tune memory configurations.
* Investigate potential [Object store issues](#object-store-issues).
## State update bottleneck (write)
If state updates are slow, executors may be blocked while waiting for space in the storage write buffer (also known as the shared buffer).
**Indicators:**
There are two ways to check whether the state update is backpressured by a full shared buffer:
1. **Search for `blocked at requiring memory` in CN logs**. If it shows up, some state table writes are waiting for the shared buffer quota to be released.
2. **Check the “uploading memory - compute” metric** (Grafana dashboard (dev) > **Hummock (Write)** > **Uploader Memory Size**). The shared buffer capacity is by default configured to be 4GB at max. If you see this time series consistently at or near the maximum, the shared buffer is likely full.
Navigate to ***Grafana dashboard (dev) > Hummock (Write) > Uploader Memory Size***
*Figure 11: Cache operations in Grafana.*
* `meta_miss`: Should ideally be close to 0%.
* `data_miss`: Represents misses that require access to the remote object store.
**Indicators:**
* `meta_miss` is non-zero.
* `data_miss` is high.
**Actions:**
* Scale up the Streaming Node or tune memory configurations.
* Investigate potential [Object store issues](#object-store-issues).
## State update bottleneck (write)
If state updates are slow, executors may be blocked while waiting for space in the storage write buffer (also known as the shared buffer).
**Indicators:**
There are two ways to check whether the state update is backpressured by a full shared buffer:
1. **Search for `blocked at requiring memory` in CN logs**. If it shows up, some state table writes are waiting for the shared buffer quota to be released.
2. **Check the “uploading memory - compute” metric** (Grafana dashboard (dev) > **Hummock (Write)** > **Uploader Memory Size**). The shared buffer capacity is by default configured to be 4GB at max. If you see this time series consistently at or near the maximum, the shared buffer is likely full.
Navigate to ***Grafana dashboard (dev) > Hummock (Write) > Uploader Memory Size***
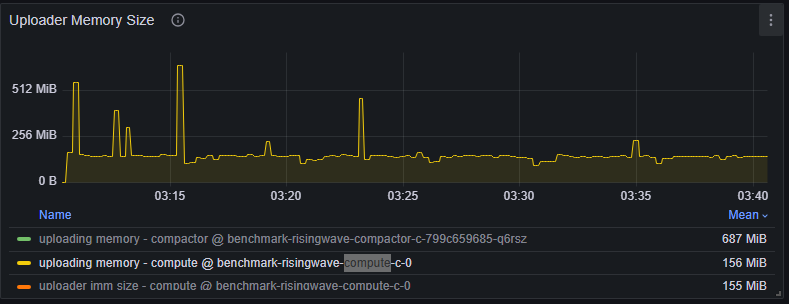 *Figure 12: Uploader memory size in Grafana.*
There can be multiple causes that can lead to the state update bottleneck.
### Slow object store writes
The shared buffer can only be released after in-memory state updates are flushed to the persistent remote object store.
Navigate to ***Grafana dashboard (dev) > Streaming > Barrier sync latency***
*Figure 12: Uploader memory size in Grafana.*
There can be multiple causes that can lead to the state update bottleneck.
### Slow object store writes
The shared buffer can only be released after in-memory state updates are flushed to the persistent remote object store.
Navigate to ***Grafana dashboard (dev) > Streaming > Barrier sync latency***
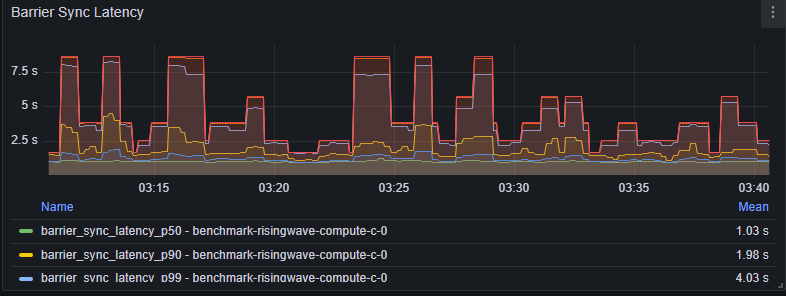 *Figure 13: Barrier sync latency in Grafana.*
**Indicators:**
* Barrier sync latency takes up most of the barrier latency.
**Actions:**
* Investigate potential [Object store issues](#object-store-issues).
**Caveat:**
* High barrier sync latency doesn't *always* mean slow object store writes. An overwhelmed storage event handler can also cause this.
### Overwhelmed storage event handler
Storage uses an event loop to propagate storage events. If events pile up, state uploads can be delayed.
Navigate to ***Grafana dashboard (dev) > Hummock (Write) > Event handler pending event number***
*Figure 13: Barrier sync latency in Grafana.*
**Indicators:**
* Barrier sync latency takes up most of the barrier latency.
**Actions:**
* Investigate potential [Object store issues](#object-store-issues).
**Caveat:**
* High barrier sync latency doesn't *always* mean slow object store writes. An overwhelmed storage event handler can also cause this.
### Overwhelmed storage event handler
Storage uses an event loop to propagate storage events. If events pile up, state uploads can be delayed.
Navigate to ***Grafana dashboard (dev) > Hummock (Write) > Event handler pending event number***
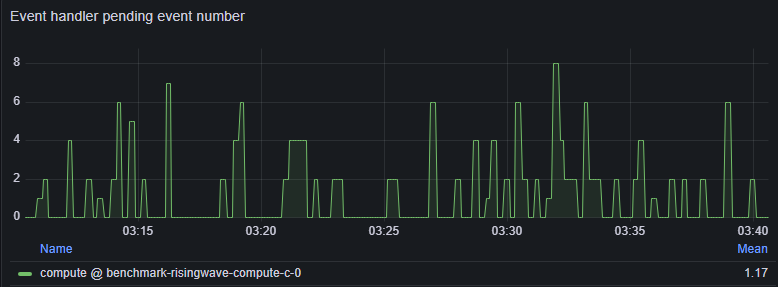 *Figure 14: Event handler pending event number in Grafana.*
**Indicators:**
* The event number remains consistently high. This often indicates too many actors/state tables on a single Streaming Node.
**Actions:**
* Check the per-compute-node actor count: Grafana dashboard (dev) > **Actor/Table Id Info** > **Actor Count (Group By Compute Node)**
* Add more Compute Nodes and rebalance actors.
## Compaction bottleneck
Compaction merges and reorganizes data in storage, improving query performance and reclaiming space. Compaction bottlenecks can manifest in two main ways:
### Write stall
**Indicators:**
* Rows returned by this SQL query:
```sql theme={null}
=> SELECT id,
compaction_config->>'level0StopWriteThresholdSubLevelNumber' as write_stop_threshold,
active_write_limit
FROM rw_hummock_compaction_group_configs
WHERE active_write_limit is not null;
id | write_stop_threshold | active_write_limit
----+----------------------+---------------------------------------------------------------------
3 | 300 | {"reason": "too many L0 sub levels: 301 > 300", "tableIds": [1001]}
(1 row)
```
* Data points shown in Grafana dashboard (dev) > **Hummock Manager** > **Write Stop Compaction Groups**.
*Figure 14: Event handler pending event number in Grafana.*
**Indicators:**
* The event number remains consistently high. This often indicates too many actors/state tables on a single Streaming Node.
**Actions:**
* Check the per-compute-node actor count: Grafana dashboard (dev) > **Actor/Table Id Info** > **Actor Count (Group By Compute Node)**
* Add more Compute Nodes and rebalance actors.
## Compaction bottleneck
Compaction merges and reorganizes data in storage, improving query performance and reclaiming space. Compaction bottlenecks can manifest in two main ways:
### Write stall
**Indicators:**
* Rows returned by this SQL query:
```sql theme={null}
=> SELECT id,
compaction_config->>'level0StopWriteThresholdSubLevelNumber' as write_stop_threshold,
active_write_limit
FROM rw_hummock_compaction_group_configs
WHERE active_write_limit is not null;
id | write_stop_threshold | active_write_limit
----+----------------------+---------------------------------------------------------------------
3 | 300 | {"reason": "too many L0 sub levels: 301 > 300", "tableIds": [1001]}
(1 row)
```
* Data points shown in Grafana dashboard (dev) > **Hummock Manager** > **Write Stop Compaction Groups**.
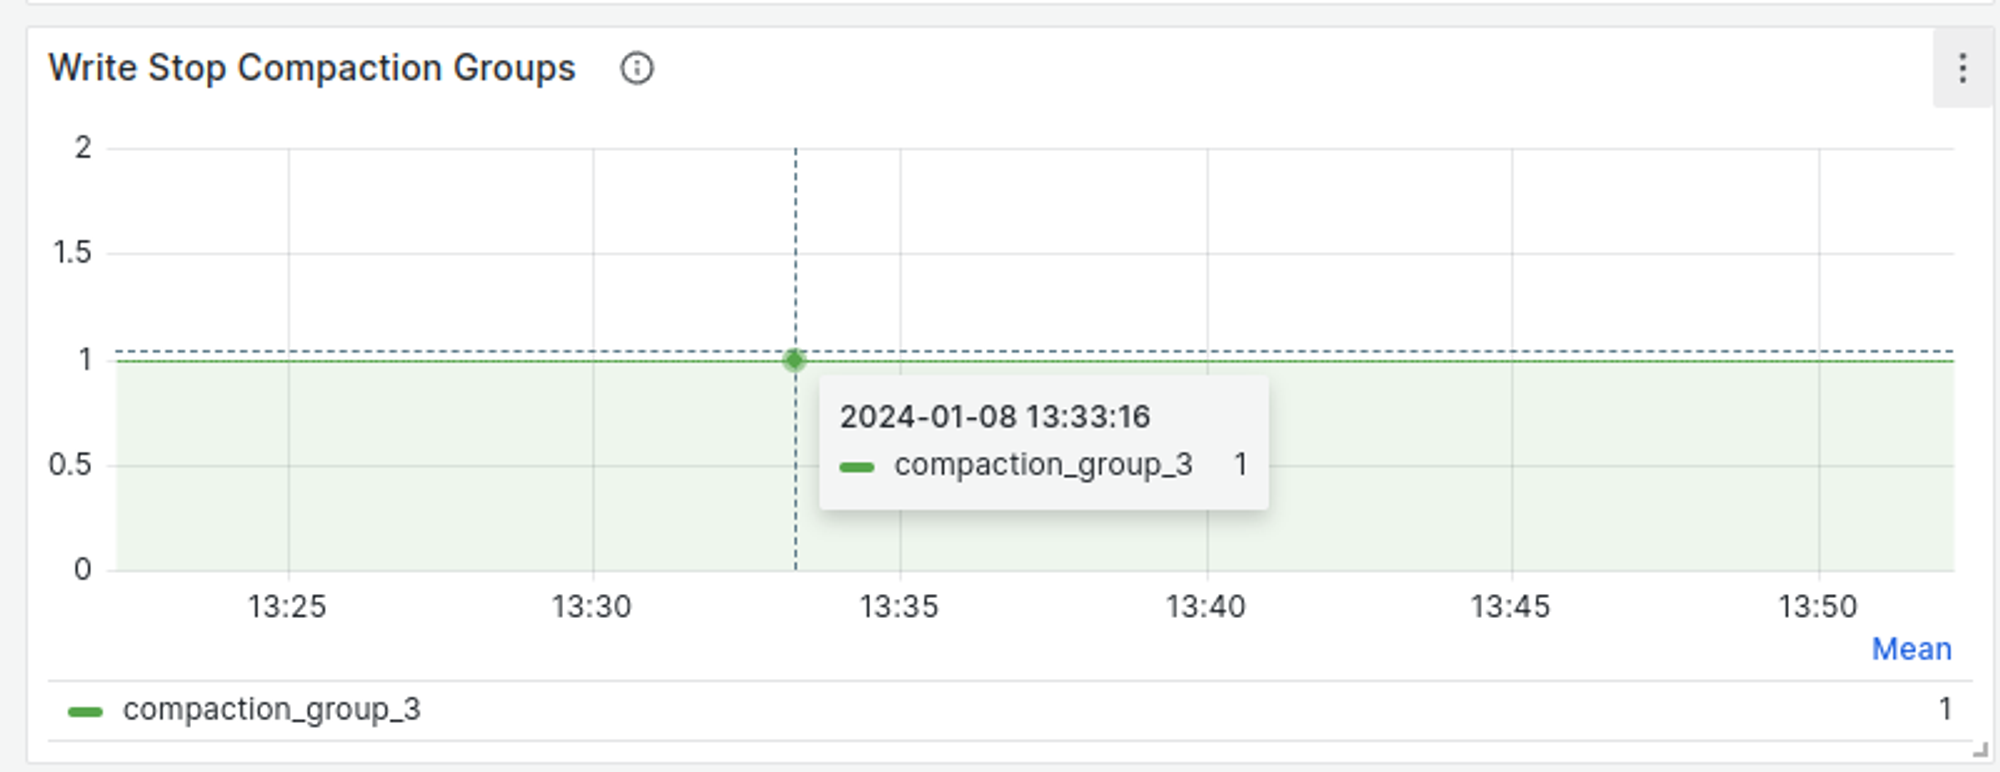 *Figure 15: Write stop compaction groups in Grafana.*
* Compactor CPU is fully utilized: Grafana dashboard (dev) > **Cluster Node** > **Node CPU panel**, find the "cpu usage (avg per core) - compactor"
*Figure 16: Compactor CPU usage in Grafana.*
* Await Tree is stuck during the flush (visible in the Await Tree Dump).
**Actions:**
* Scale up/out compactors. A recommended ratio is CN cores : compactor cores = 2 : 1.
* Investigate potential [Object store issues](#object-store-issues).
* If scaling doesn't resolve the issue, collect compactor logs, snapshots of the "Object Store" and "Compaction" panels in the Grafana dev dashboard, and the results of these SQL queries for further investigation:
```sql theme={null}
SELECT compaction_group_id,
level_id,
level_type,
sub_level_id,
count(*) AS total_file_count,
round(Sum(file_size) / 1024.0) AS total_file_size_kb
FROM rw_catalog.rw_hummock_sstables
GROUP BY compaction_group_id,
level_type,
level_id,
sub_level_id
ORDER BY compaction_group_id,
level_id,
sub_level_id DESC;
SELECT * FROM rw_hummock_compaction_group_configs;
```
**Caveats:**
* Compactors are primarily CPU-bound, so you can allocate less memory if needed (e.g., 4C 4GB is acceptable).
### Too many tombstones or stale keys
Navigate to ***Grafana dashboard (dev) > Hummock Manager > Epoch***
*Figure 15: Write stop compaction groups in Grafana.*
* Compactor CPU is fully utilized: Grafana dashboard (dev) > **Cluster Node** > **Node CPU panel**, find the "cpu usage (avg per core) - compactor"
*Figure 16: Compactor CPU usage in Grafana.*
* Await Tree is stuck during the flush (visible in the Await Tree Dump).
**Actions:**
* Scale up/out compactors. A recommended ratio is CN cores : compactor cores = 2 : 1.
* Investigate potential [Object store issues](#object-store-issues).
* If scaling doesn't resolve the issue, collect compactor logs, snapshots of the "Object Store" and "Compaction" panels in the Grafana dev dashboard, and the results of these SQL queries for further investigation:
```sql theme={null}
SELECT compaction_group_id,
level_id,
level_type,
sub_level_id,
count(*) AS total_file_count,
round(Sum(file_size) / 1024.0) AS total_file_size_kb
FROM rw_catalog.rw_hummock_sstables
GROUP BY compaction_group_id,
level_type,
level_id,
sub_level_id
ORDER BY compaction_group_id,
level_id,
sub_level_id DESC;
SELECT * FROM rw_hummock_compaction_group_configs;
```
**Caveats:**
* Compactors are primarily CPU-bound, so you can allocate less memory if needed (e.g., 4C 4GB is acceptable).
### Too many tombstones or stale keys
Navigate to ***Grafana dashboard (dev) > Hummock Manager > Epoch***
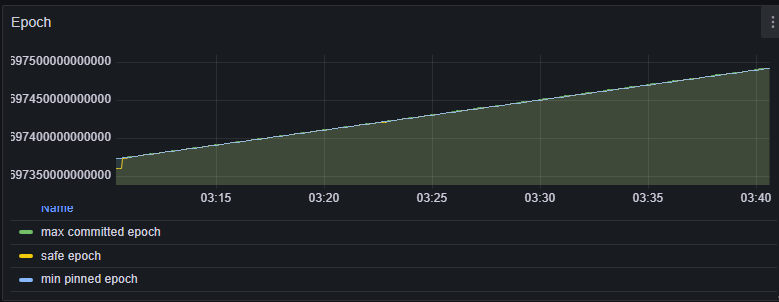 *Figure 17: Epoch information in Grafana.*
Data between `safe_epoch` and `max_committed_epoch` is readable in a multi-version concurrency control (MVCC) manner. Compaction cannot reclaim data written above `min_pinned_epoch`.
**Indicators:**
* A large gap between `safe_epoch` / `min_pinned_epoch` and `max_committed_epoch`.
**Actions:**
* Check for long-running batch queries: `SHOW PROCESSLIST;`
* Trigger a manual recovery: `RECOVER;`
* Restart all serving nodes.
## UDF bottleneck
Slow User-Defined Function (UDF) calls can significantly impact performance, as UDF invocation is in the critical path of streaming computation.
Navigate to ***Grafana dashboard (dev) > User Defined Function section***
*Figure 17: Epoch information in Grafana.*
Data between `safe_epoch` and `max_committed_epoch` is readable in a multi-version concurrency control (MVCC) manner. Compaction cannot reclaim data written above `min_pinned_epoch`.
**Indicators:**
* A large gap between `safe_epoch` / `min_pinned_epoch` and `max_committed_epoch`.
**Actions:**
* Check for long-running batch queries: `SHOW PROCESSLIST;`
* Trigger a manual recovery: `RECOVER;`
* Restart all serving nodes.
## UDF bottleneck
Slow User-Defined Function (UDF) calls can significantly impact performance, as UDF invocation is in the critical path of streaming computation.
Navigate to ***Grafana dashboard (dev) > User Defined Function section***
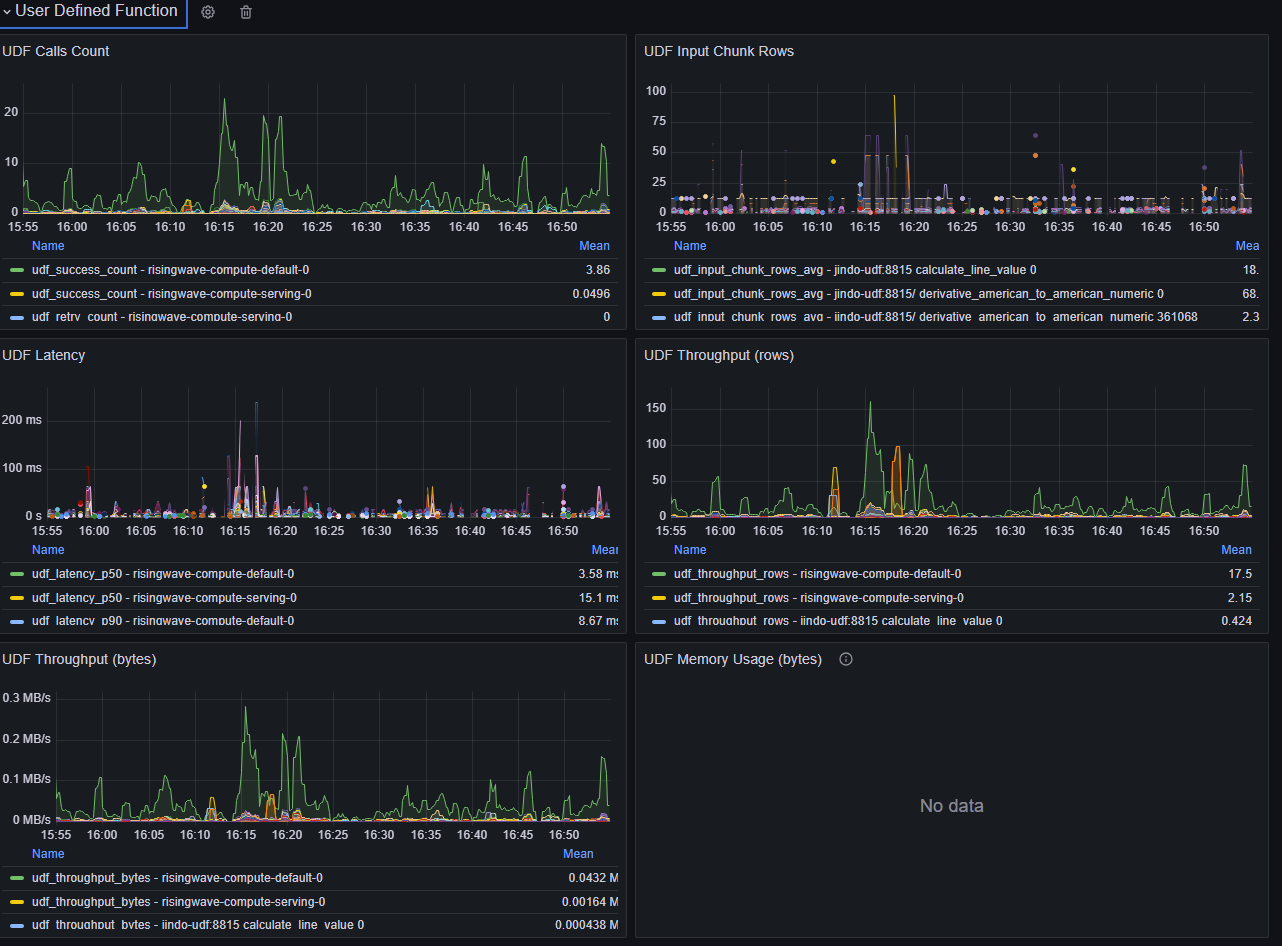 *Figure 18: User-defined function metrics in Grafana.*
**Indicators:**
* Consistently high UDF latency.
**Actions:**
* Check for network calls or I/O within the UDF.
* If using a UDF server, verify good network connectivity between RisingWave and the server.
## Object store issues
Navigate to ***Grafana dashboard (dev) > Object Store > Operation Rate/Duration/Failure Rate/Retry Rate***
*Figure 18: User-defined function metrics in Grafana.*
**Indicators:**
* Consistently high UDF latency.
**Actions:**
* Check for network calls or I/O within the UDF.
* If using a UDF server, verify good network connectivity between RisingWave and the server.
## Object store issues
Navigate to ***Grafana dashboard (dev) > Object Store > Operation Rate/Duration/Failure Rate/Retry Rate***
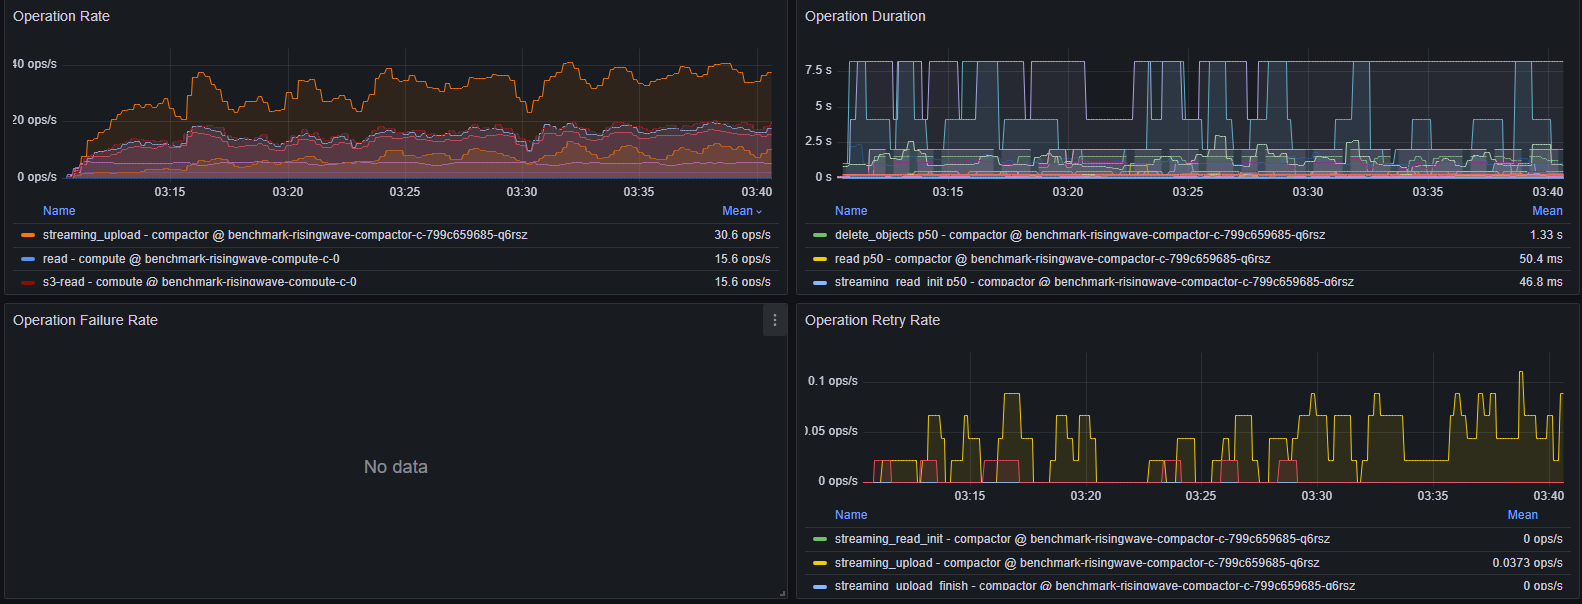 *Figure 19: Object store metrics in Grafana.*
Potential causes of object store slowness include:
1. **High Operation Duration:** Check logs for errors/warnings.
2. **High Operation Rate:** With S3, >3000 OPS may cause duration spikes. Consider scaling up Compute Nodes to reduce cache misses.
3. **Persistent Operation Failure Rate:** Indicates misconfiguration or network/object store unavailability. Check logs.
4. **Persistent Operation Retry Rate:** Indicates misconfiguration or network/object store unavailability. Check logs. If retries are due to timeouts, consider tuning retry configurations.
## Sink issues
Navigate to ***Grafana dashboard (dev) > User Streaming Errors > Sink Errors By Type***
*Figure 19: Object store metrics in Grafana.*
Potential causes of object store slowness include:
1. **High Operation Duration:** Check logs for errors/warnings.
2. **High Operation Rate:** With S3, >3000 OPS may cause duration spikes. Consider scaling up Compute Nodes to reduce cache misses.
3. **Persistent Operation Failure Rate:** Indicates misconfiguration or network/object store unavailability. Check logs.
4. **Persistent Operation Retry Rate:** Indicates misconfiguration or network/object store unavailability. Check logs. If retries are due to timeouts, consider tuning retry configurations.
## Sink issues
Navigate to ***Grafana dashboard (dev) > User Streaming Errors > Sink Errors By Type***
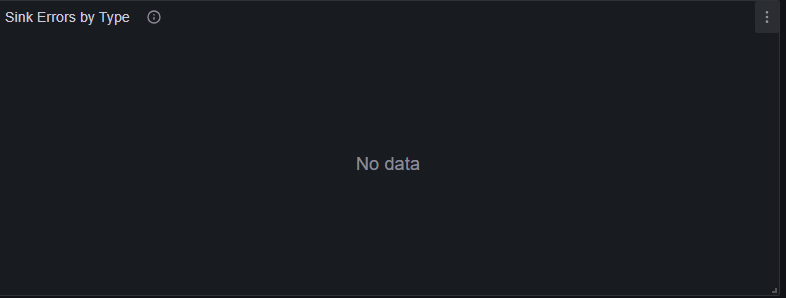 *Figure 20: Sink errors in Grafana.*
You should ideally see no errors here. If errors are present, search for "sink" and "Error" in the node logs.
If other indicators (e.g., the Await Tree Dump) suggest a sink bottleneck, consider enabling sink decoupling to isolate temporary sink slowness. See [Sink decoupling](/delivery/overview#sink-decoupling).
**Caveats:**
* Sink decoupling isolates the sink but doesn't improve its throughput. If the log store lag increases after enabling decoupling, investigate the sink itself:
Navigate to ***Grafana dashboard (dev) > Sink Metrics > Log Store Lag***
*Figure 20: Sink errors in Grafana.*
You should ideally see no errors here. If errors are present, search for "sink" and "Error" in the node logs.
If other indicators (e.g., the Await Tree Dump) suggest a sink bottleneck, consider enabling sink decoupling to isolate temporary sink slowness. See [Sink decoupling](/delivery/overview#sink-decoupling).
**Caveats:**
* Sink decoupling isolates the sink but doesn't improve its throughput. If the log store lag increases after enabling decoupling, investigate the sink itself:
Navigate to ***Grafana dashboard (dev) > Sink Metrics > Log Store Lag***
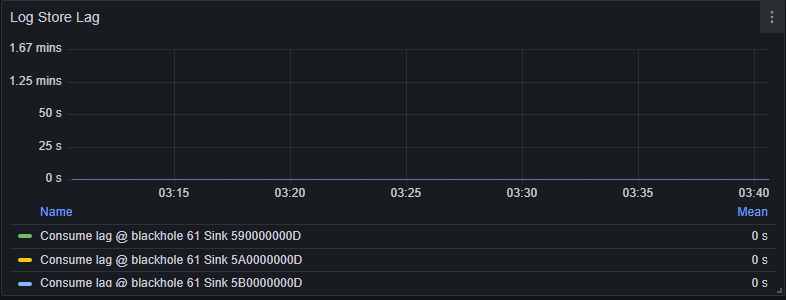 *Figure 21: Log store lag in Grafana.*