> ## Documentation Index
> Fetch the complete documentation index at: https://docs.risingwave.com/llms.txt
> Use this file to discover all available pages before exploring further.
# Configure Superset to read data from RisingWave
> Apache Superset is an open-source data exploration and data visualization software application. As a database, RisingWave can act as a data source for Business Intelligence tools like Apache Superset.
This guide will go over how to:
* Connect RisingWave to Superset.
* Create a dashboard.
## Prerequisites
### Install and start RisingWave
To install and start RisingWave locally, see the [Get started](/get-started/quickstart) guide. We recommend running RisingWave locally for demo purposes.
Connect to a streaming source. For details on connecting to streaming sources and what sources are supported with RisingWave, see [CREATE SOURCE](/sql/commands/sql-create-source).
### Install Apache Superset
To install Apache Superset, follow the instructions in [Installing locally using Docker Compose](https://superset.apache.org/docs/installation/installing-superset-using-docker-compose#installing-superset-locally-using-docker-compose). This guide will cover how to install the database driver in Docker, so we recommend installing it using Docker Compose.
## Establish the connection between Superset and RisingWave
### Start Apache Superset
Launch an instance of Apache Superset by following the instructions in [Launch Superset through Docker Compose](https://superset.apache.org/docs/installation/installing-superset-using-docker-compose#3-launch-superset-through-docker-compose). To start Superset, enter `http://localhost:8088` into your web browser.
If it is your first time starting Superset and the webpage asks for a username and password, use `admin` for both.
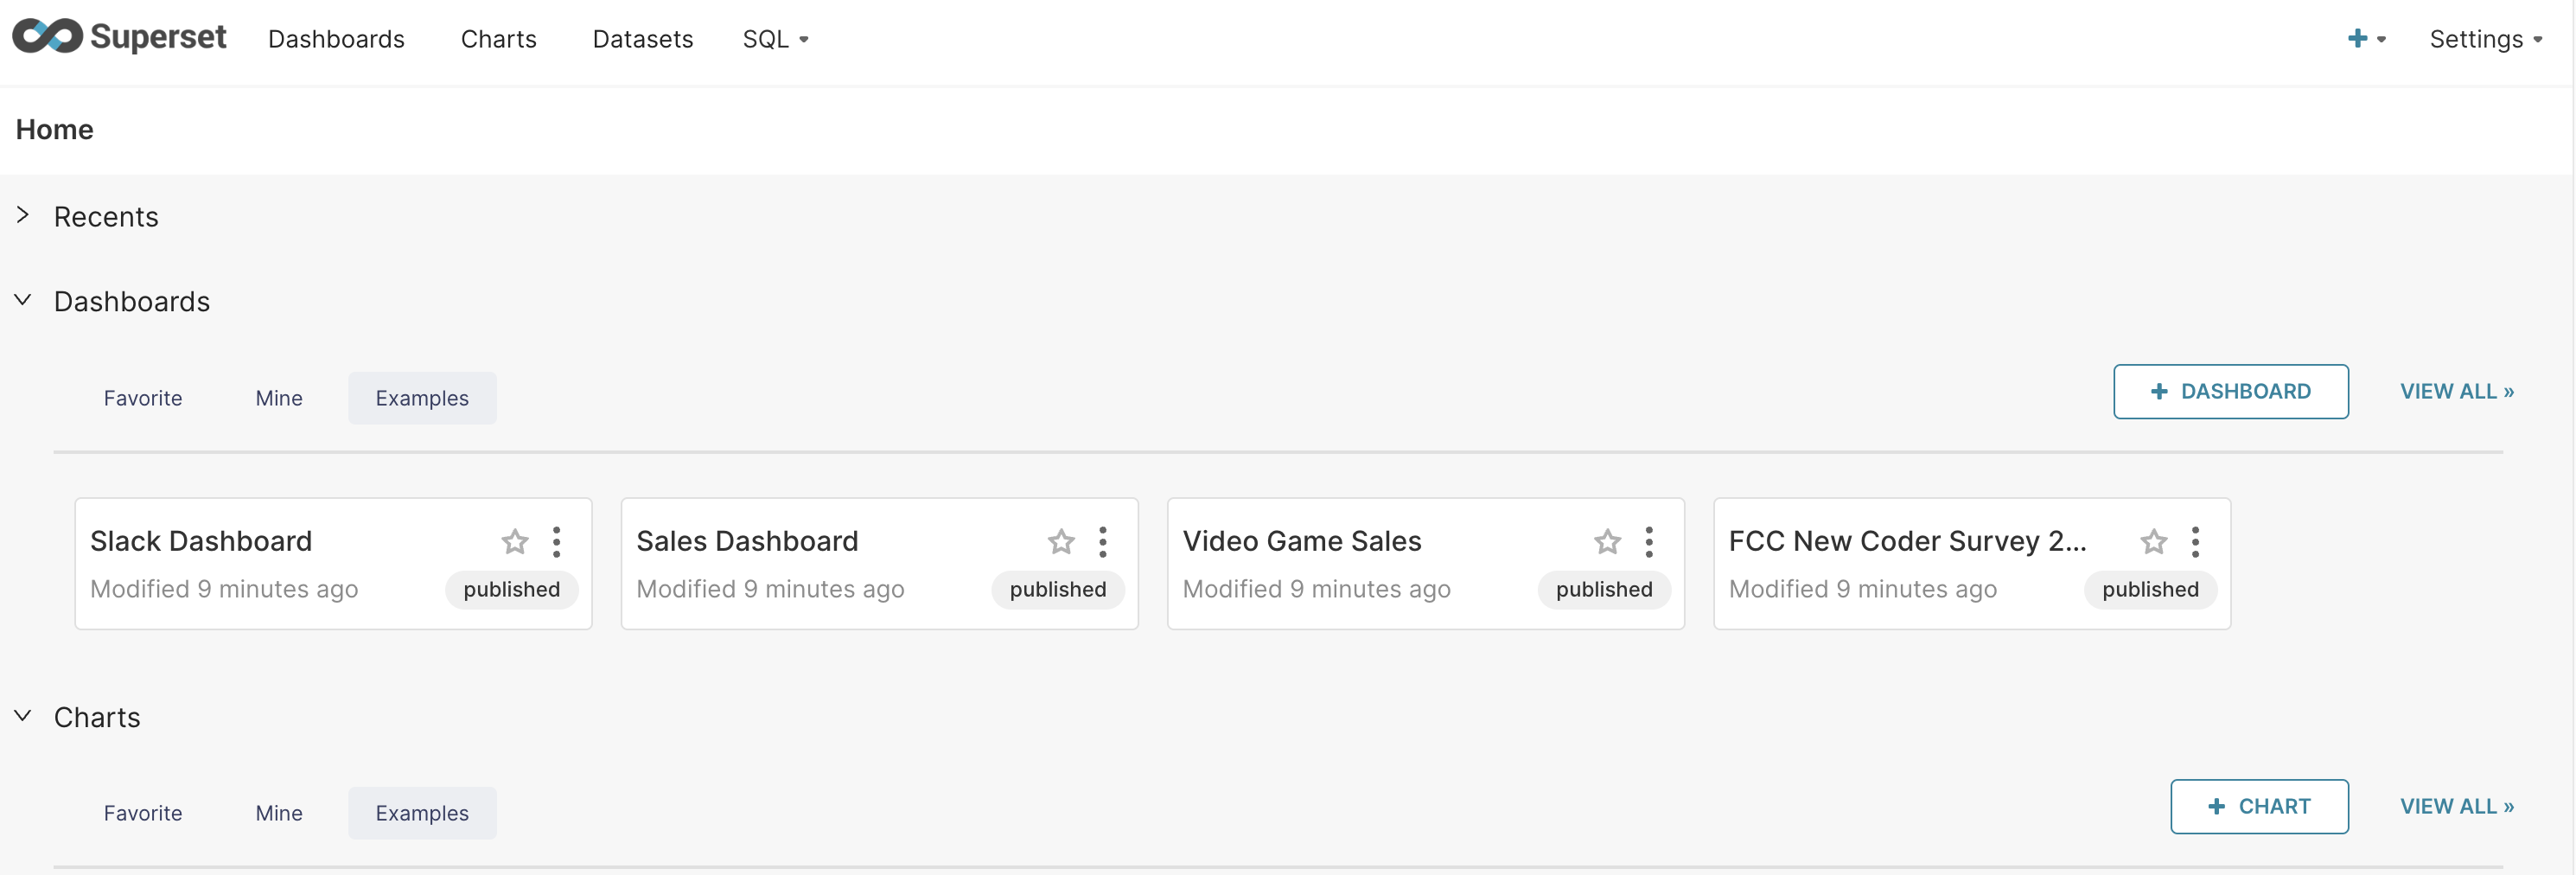
The following UI page should appear.
 ### Connect to RisingWave
> Note that, the new version of RisingWave implements a wrapper on top of the original PostgreSQL SQLAlchemy driver. Therefore, we recommend using the connector library [sqlalchemy-risingwave](https://github.com/risingwavelabs/sqlalchemy-risingwave) instead of psycopg2.
>
> If the driver is not installed in the Docker container, you can install it by running the following commands:
>
> ```shell theme={null}
> docker compose exec bash
> pip install sqlalchemy-risingwave
> exit
> docker compose restart
> ```
1. In Superset, select **Settings > Database connections**.
2. Click **+ Database**.
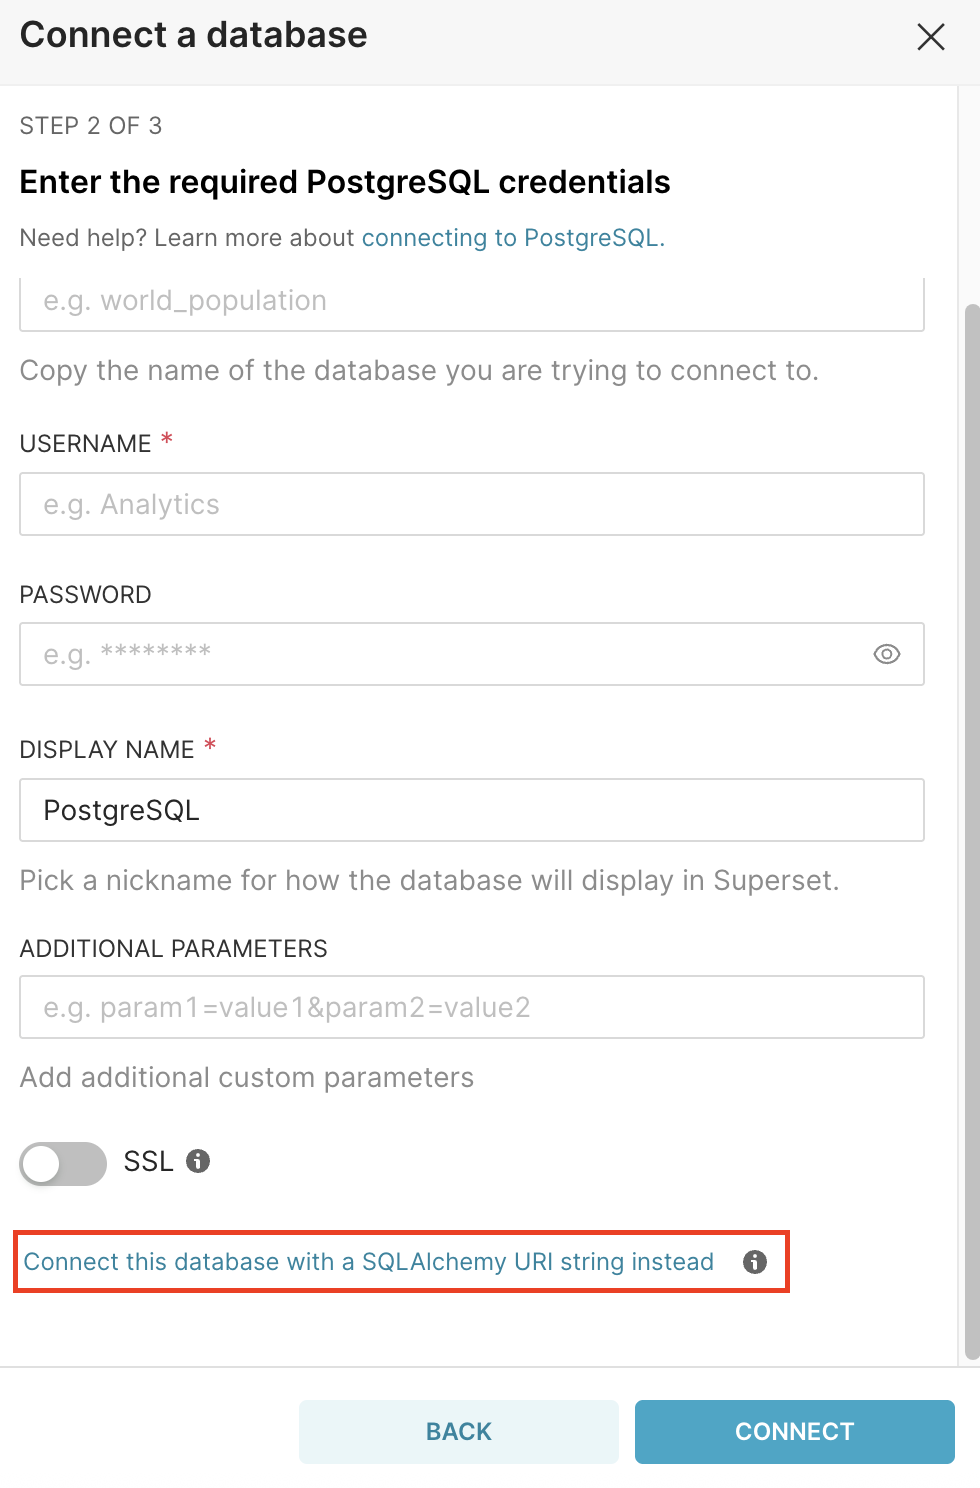
3. In the window that pops up, scroll to the bottom and select **"Connect this database with a SQLAlchemy URI string instead."**
### Connect to RisingWave
> Note that, the new version of RisingWave implements a wrapper on top of the original PostgreSQL SQLAlchemy driver. Therefore, we recommend using the connector library [sqlalchemy-risingwave](https://github.com/risingwavelabs/sqlalchemy-risingwave) instead of psycopg2.
>
> If the driver is not installed in the Docker container, you can install it by running the following commands:
>
> ```shell theme={null}
> docker compose exec bash
> pip install sqlalchemy-risingwave
> exit
> docker compose restart
> ```
1. In Superset, select **Settings > Database connections**.
2. Click **+ Database**.
3. In the window that pops up, scroll to the bottom and select **"Connect this database with a SQLAlchemy URI string instead."**
 4. Fill in SQLAlchemy URI, e.g., `risingwave://root@host.docker.internal:4566/dev`.
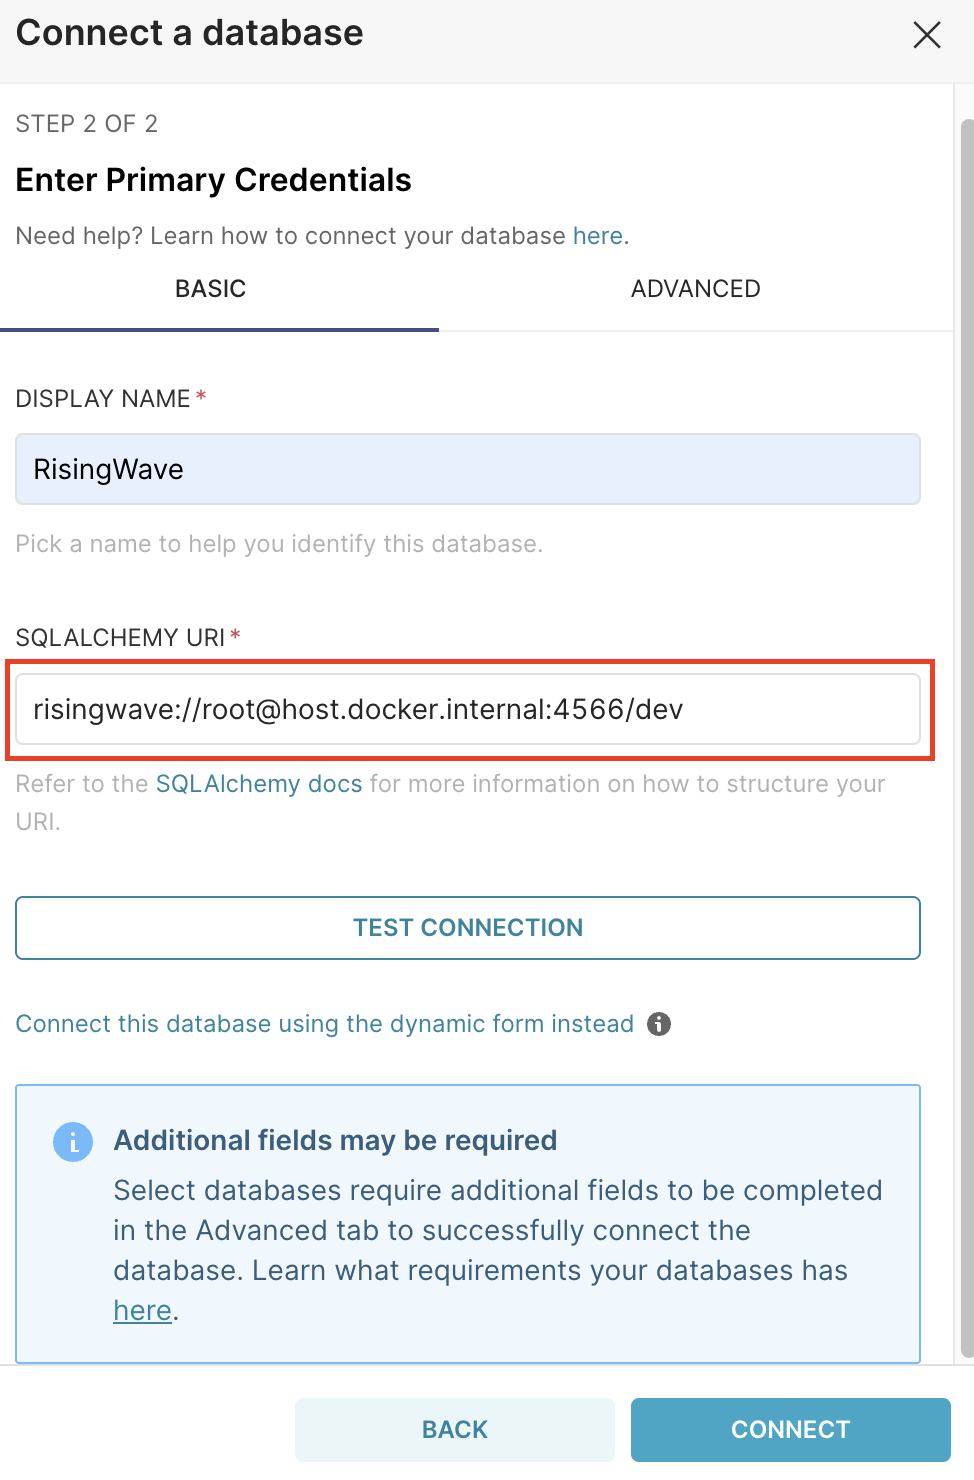 5. Click **Connect**.
## Create a dashboard
### Create tables or materialized views in RisingWave
Instead of using Superset to create materialized views or tables, use RisingWave. For this guide, we will create the table `t` and insert some data.
Once RisingWave starts, use the following queries to create the table `t` and insert some values to the table.
```sql theme={null}
CREATE TABLE t (v float, ts timestamp);
INSERT INTO t VALUES (1.0, '2022-11-15 15:35:40'),
(2.1, '2022-11-15 15:36:24'),
(3.5, '2022-11-15 15:37:32'),
(4.2, '2022-11-15 15:38:12'),
(4.2, '2022-11-15 15:38:21');
```
### Create and export tables or materialized views
Export the data from materialized views or tables in RisingWave to Superset:
1. Select **Datasets** then **+ Dataset**.
2. In the window that pops up, under **Database**, select **RisingWave**.
3. Under **Schema**, select the schema the table or materialized view was created in. By default, they are in the `public` schema.
4. Select the materialized view or table to be exported to Superset. In this guide, we'll select `t`.
Once the materialized view has been added as a dataset, it can be used to create dashboards.
### Create a dashboard in Superset
To create a dashboard based on the table `t`:
1. Click **Create chart**.
2. Select table `t`.
3. Select **Time-series line chart** as the rendering method.
4. Specify `ts` as the time column.
5. Specify `AVG(v)` as the metric.
6. Click **Update chart**. The query results will be rendered into a line chart.
5. Click **Connect**.
## Create a dashboard
### Create tables or materialized views in RisingWave
Instead of using Superset to create materialized views or tables, use RisingWave. For this guide, we will create the table `t` and insert some data.
Once RisingWave starts, use the following queries to create the table `t` and insert some values to the table.
```sql theme={null}
CREATE TABLE t (v float, ts timestamp);
INSERT INTO t VALUES (1.0, '2022-11-15 15:35:40'),
(2.1, '2022-11-15 15:36:24'),
(3.5, '2022-11-15 15:37:32'),
(4.2, '2022-11-15 15:38:12'),
(4.2, '2022-11-15 15:38:21');
```
### Create and export tables or materialized views
Export the data from materialized views or tables in RisingWave to Superset:
1. Select **Datasets** then **+ Dataset**.
2. In the window that pops up, under **Database**, select **RisingWave**.
3. Under **Schema**, select the schema the table or materialized view was created in. By default, they are in the `public` schema.
4. Select the materialized view or table to be exported to Superset. In this guide, we'll select `t`.
Once the materialized view has been added as a dataset, it can be used to create dashboards.
### Create a dashboard in Superset
To create a dashboard based on the table `t`:
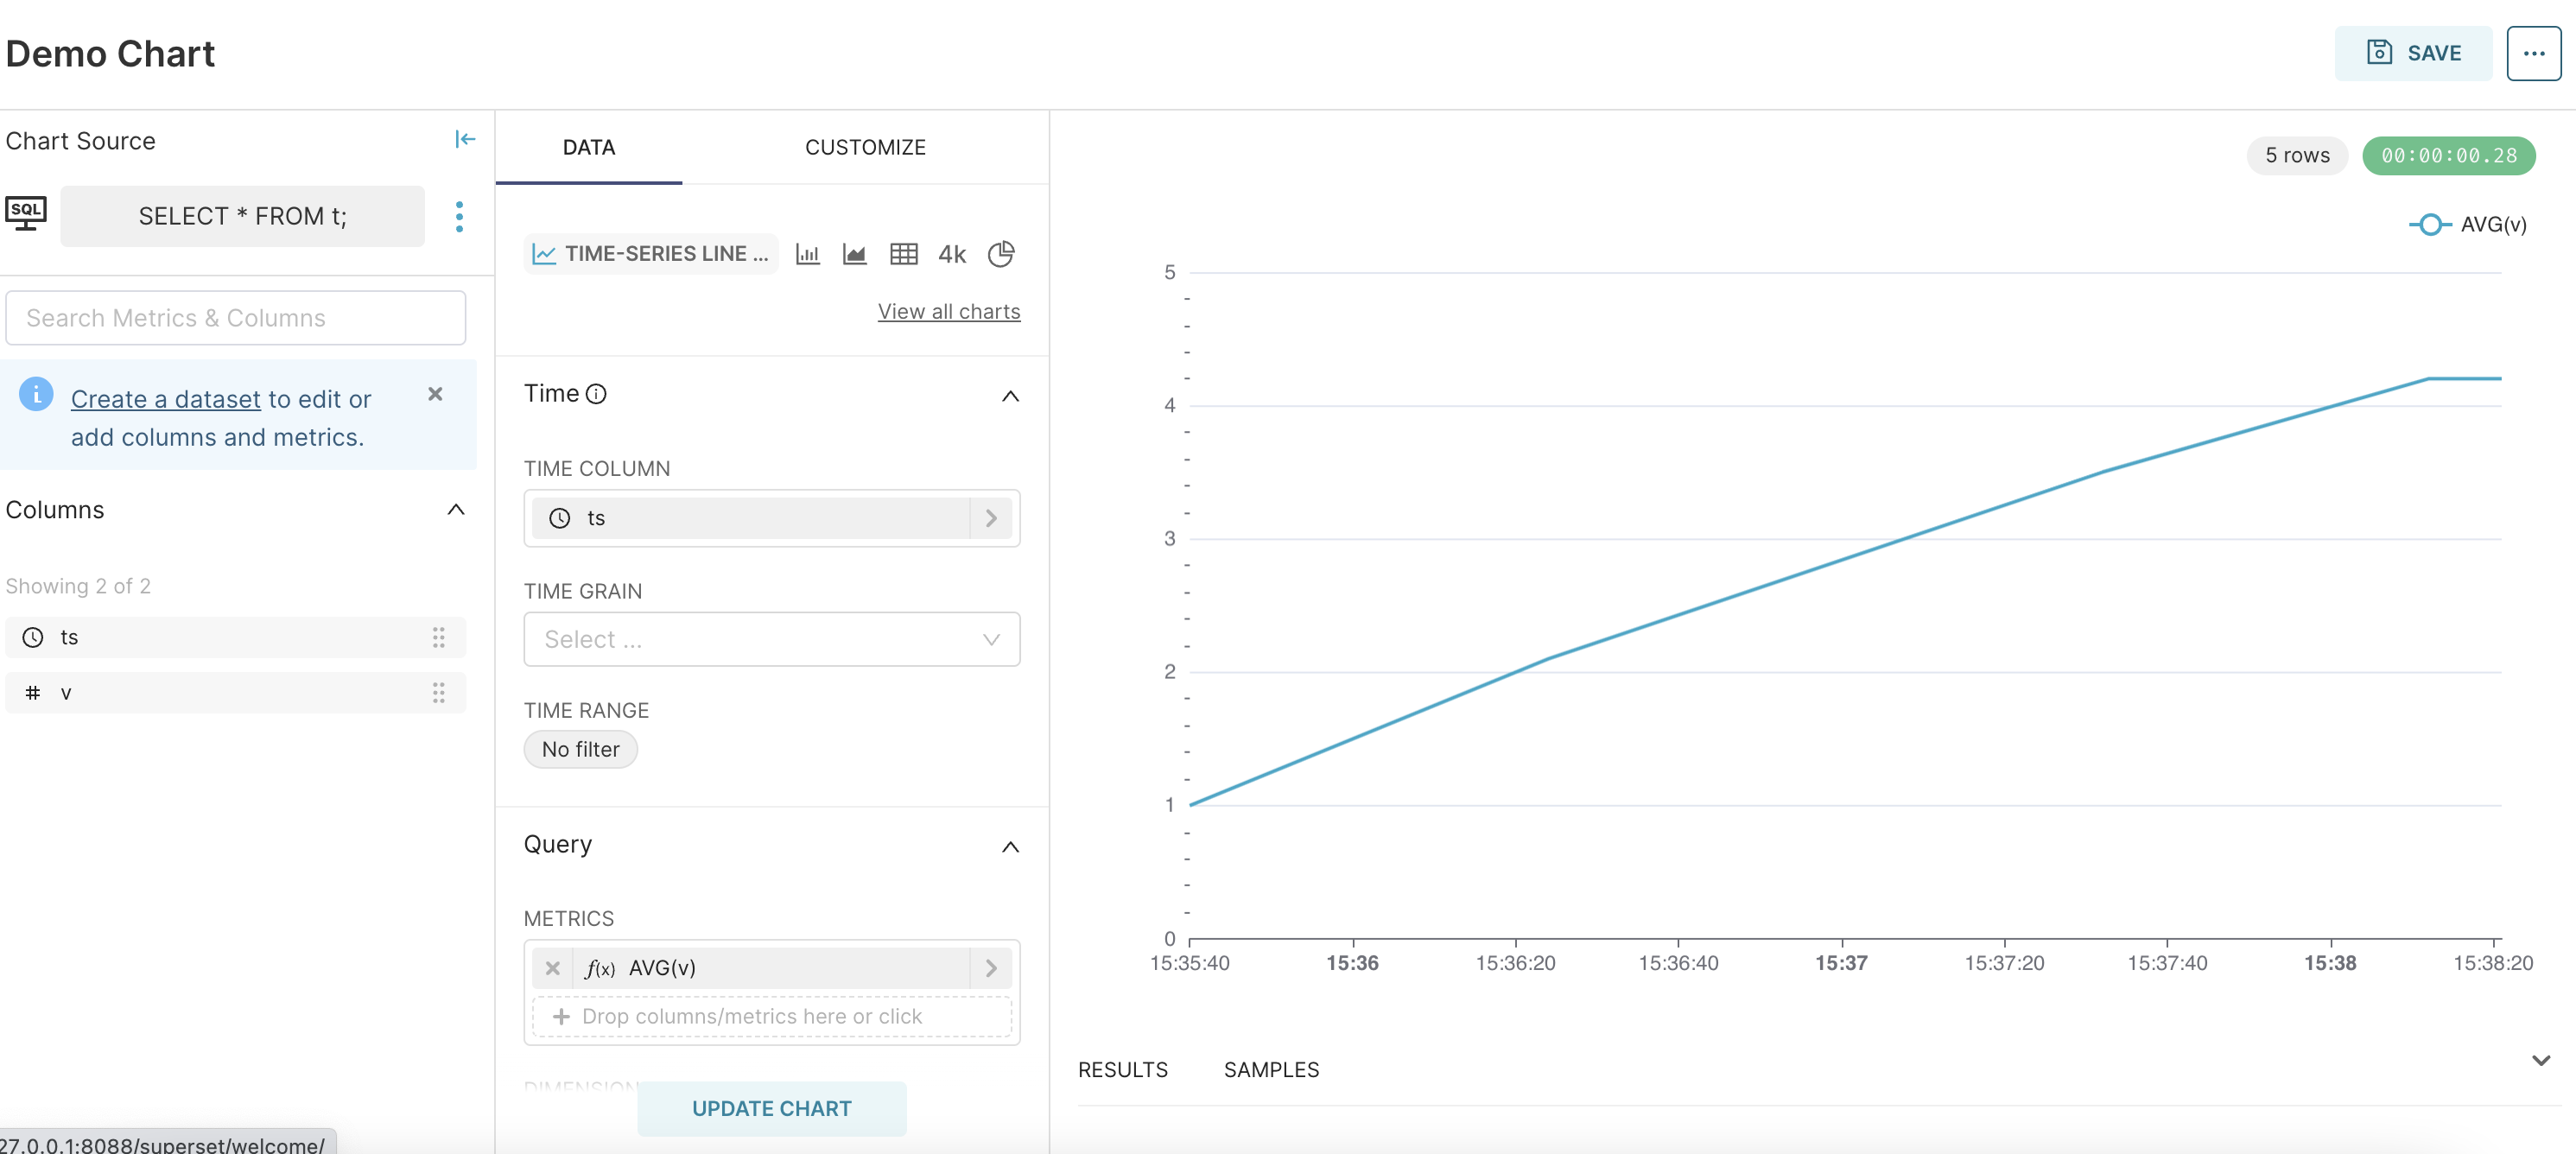
1. Click **Create chart**.
2. Select table `t`.
3. Select **Time-series line chart** as the rendering method.
4. Specify `ts` as the time column.
5. Specify `AVG(v)` as the metric.
6. Click **Update chart**. The query results will be rendered into a line chart.
 For more details on creating dashboards, see the [Creating your first dashboard](https://superset.apache.org/docs/creating-charts-dashboards/creating-your-first-dashboard#creating-charts-in-explore-view) guide.