> ## Documentation Index
> Fetch the complete documentation index at: https://docs.risingwave.com/llms.txt
> Use this file to discover all available pages before exploring further.
# Connect Looker to RisingWave
> Looker is a BI (business intelligence) platform that provides data insights through interactive dashboards, reports, and SQL querying. It can integrate with databases like PostgreSQL, MySQL, and more.
Since RisingWave is compatible with PostgreSQL, you can easily connect Looker to RisingWave by using the PostgreSQL driver.
## Prerequisites
* Ensure that [Looker](https://cloud.google.com/looker) is installed and accessible from the RisingWave cluster.
* Install and start RisingWave. For instructions on how to get started, see the [Quick start guide](/get-started/quickstart).
## Establish the connection
1. Choose the PostgreSQL connector from the list of data sources.
2. Configure the connection (here “Basic” is used as an example):
* Host: The hostname or IP address of the RisingWave database. The default **Host** for RisingWave is `localhost`.
* Port: The port number of the RisingWave database. The default **Port** for RisingWave is `4566`. If left blank, the default post of PostgreSQL `5432` will be used.
* Database: The name of the RisingWave database you want to connect to. The default **Database** is `dev`.
* Username: The username for accessing the database. The default **Username** is `root`.
* Password: The password associated with the provided username. By default, there is no password for `root`.
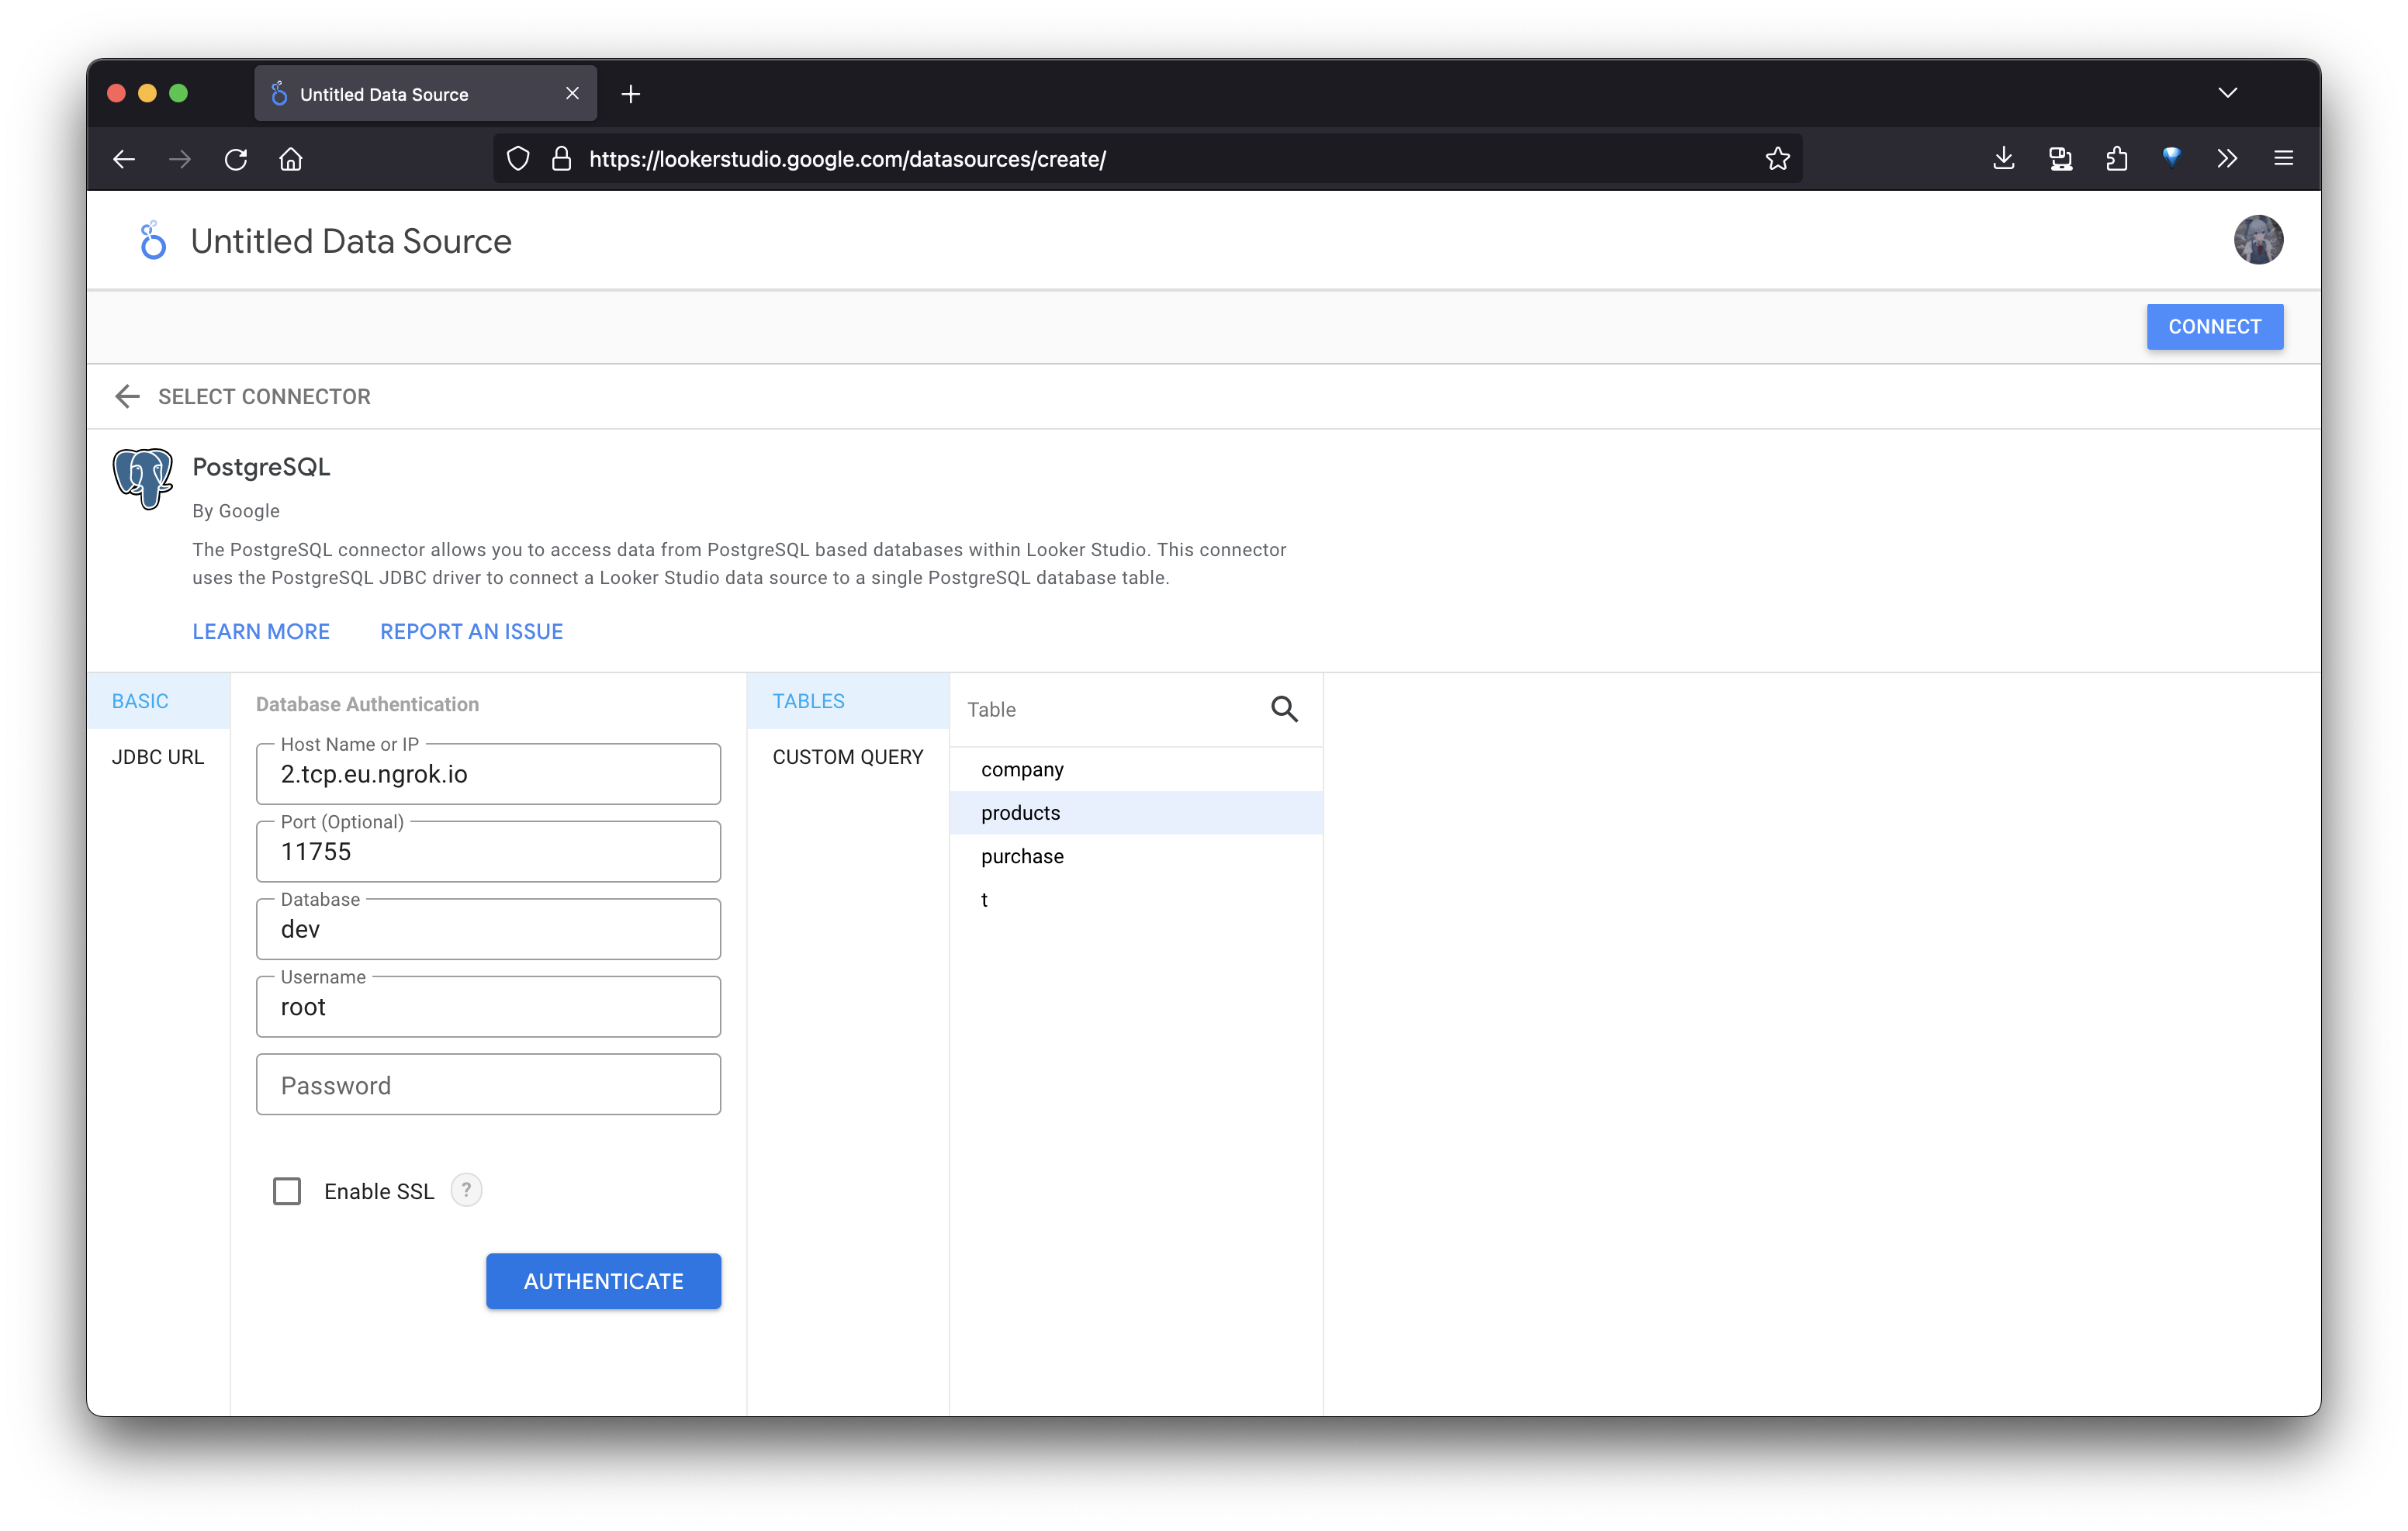 3. Click `AUTHENTICATE` to confirm the connection is successful.
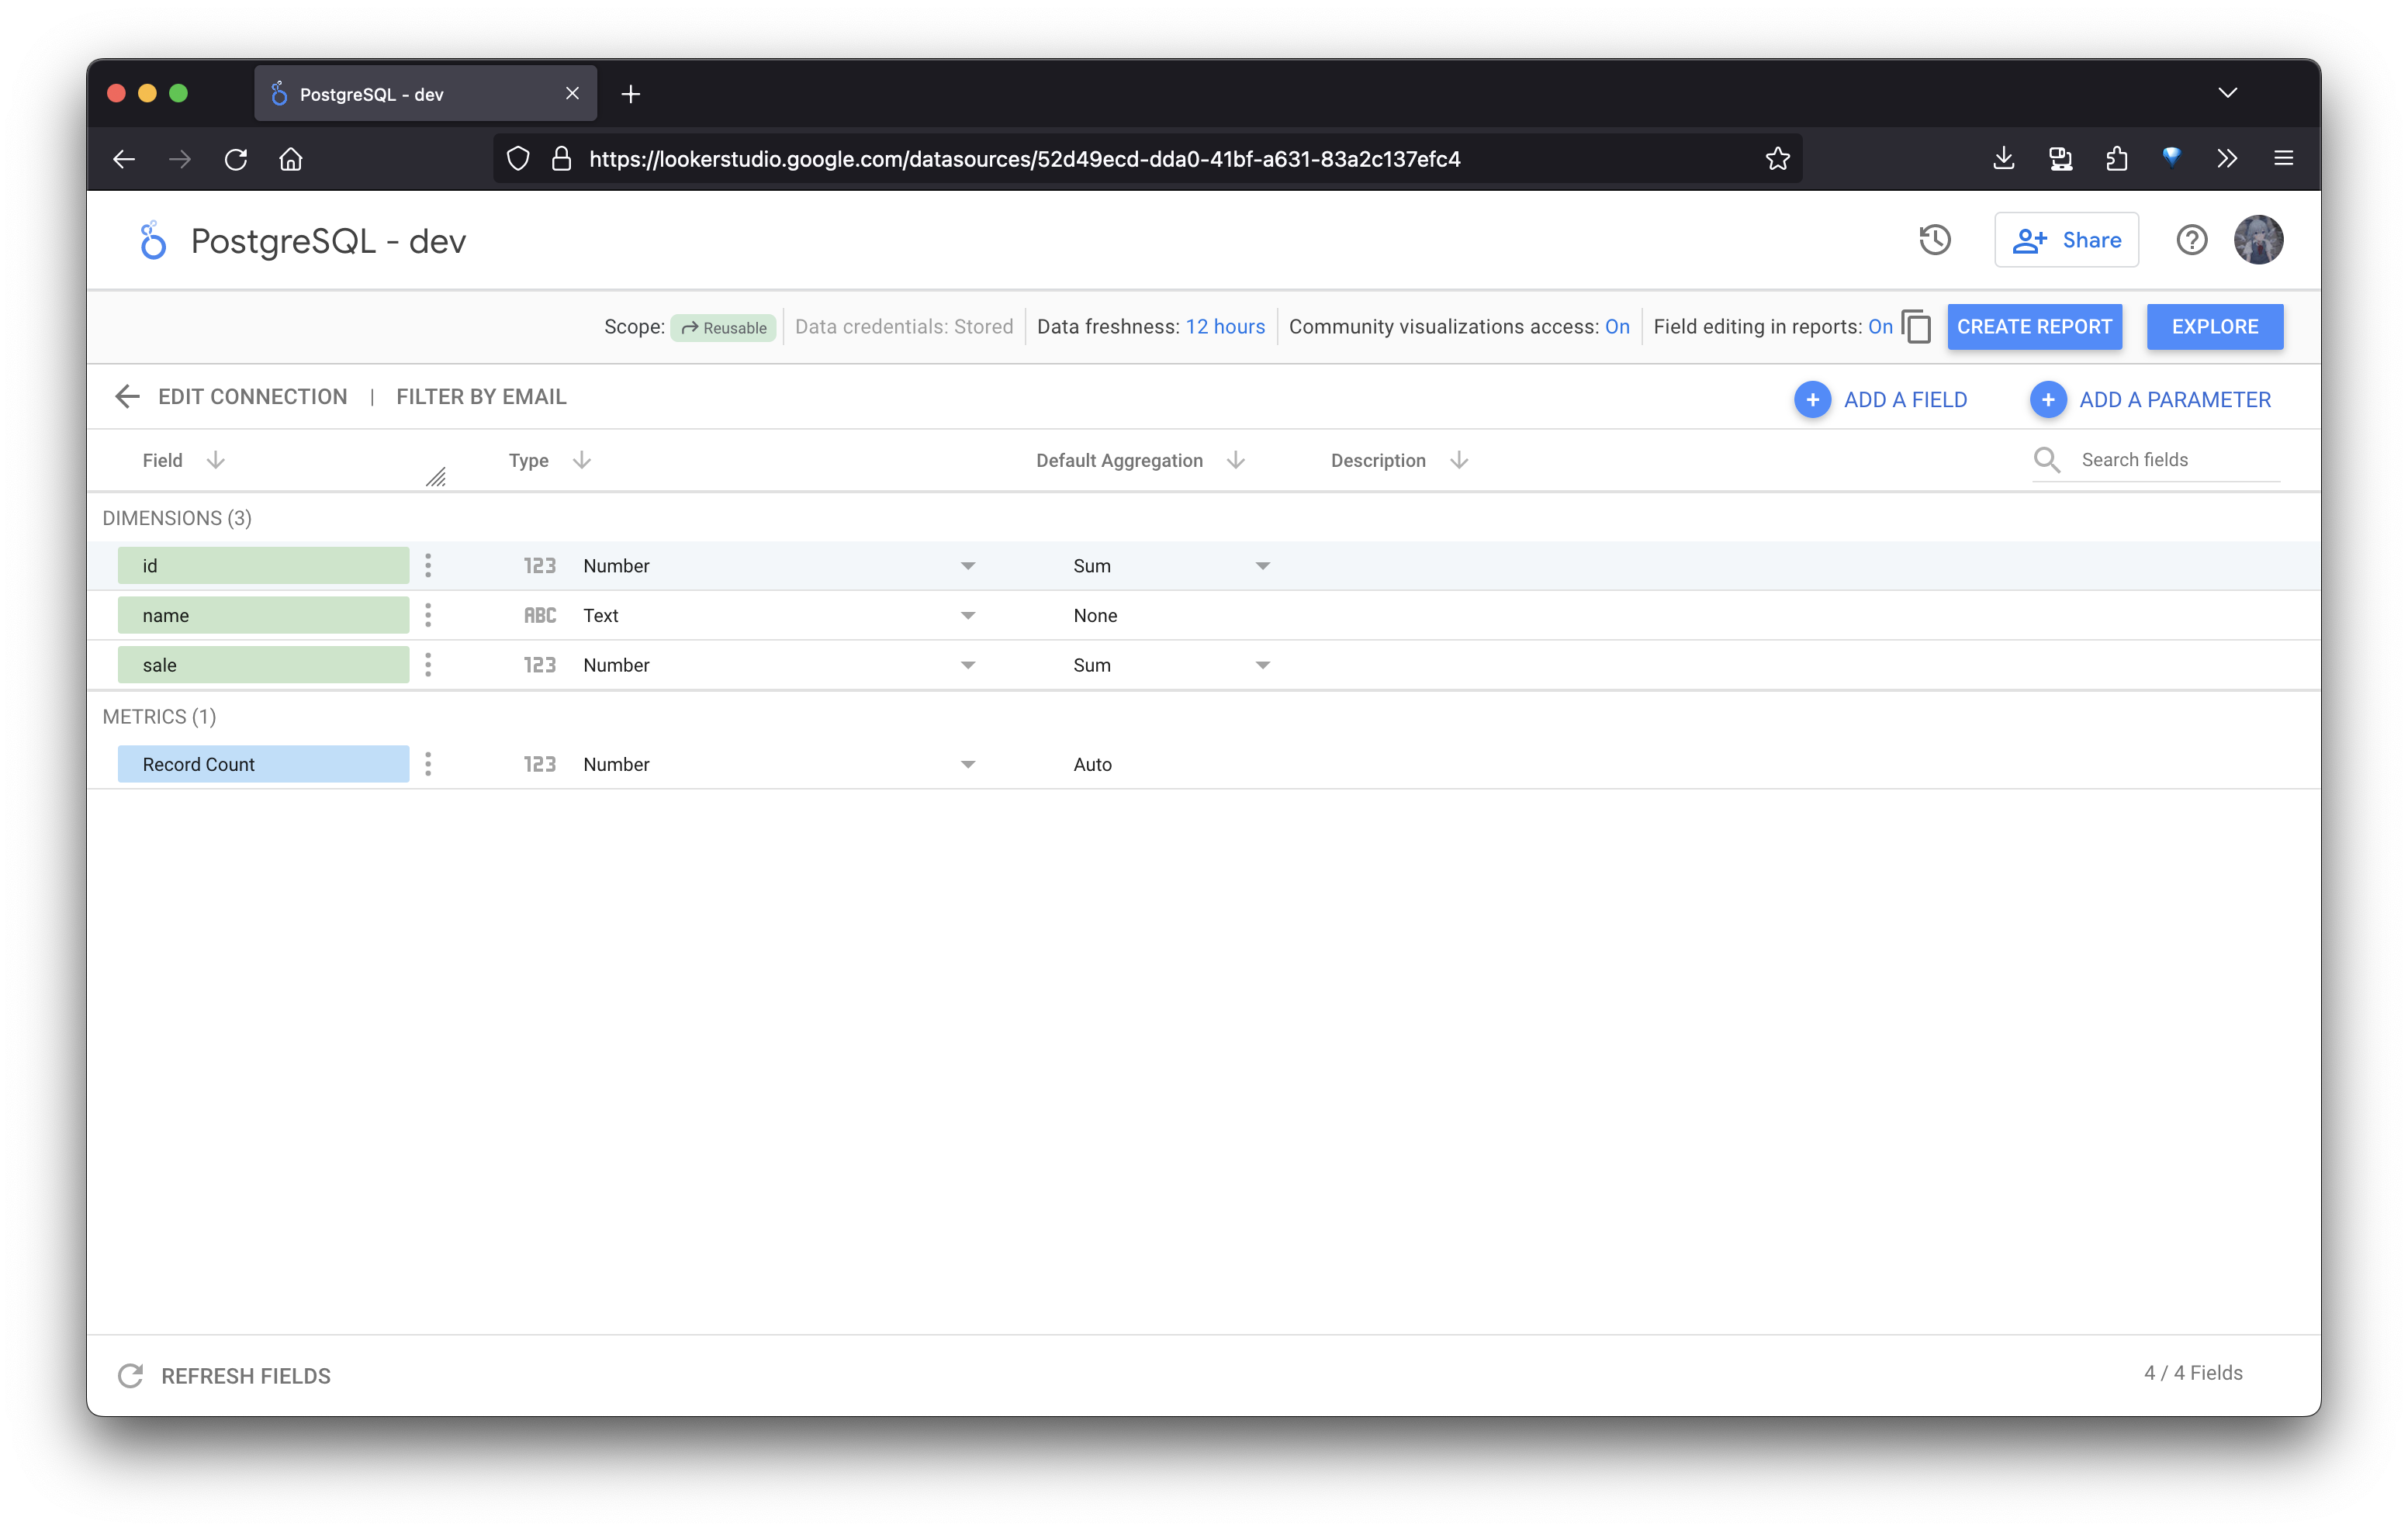
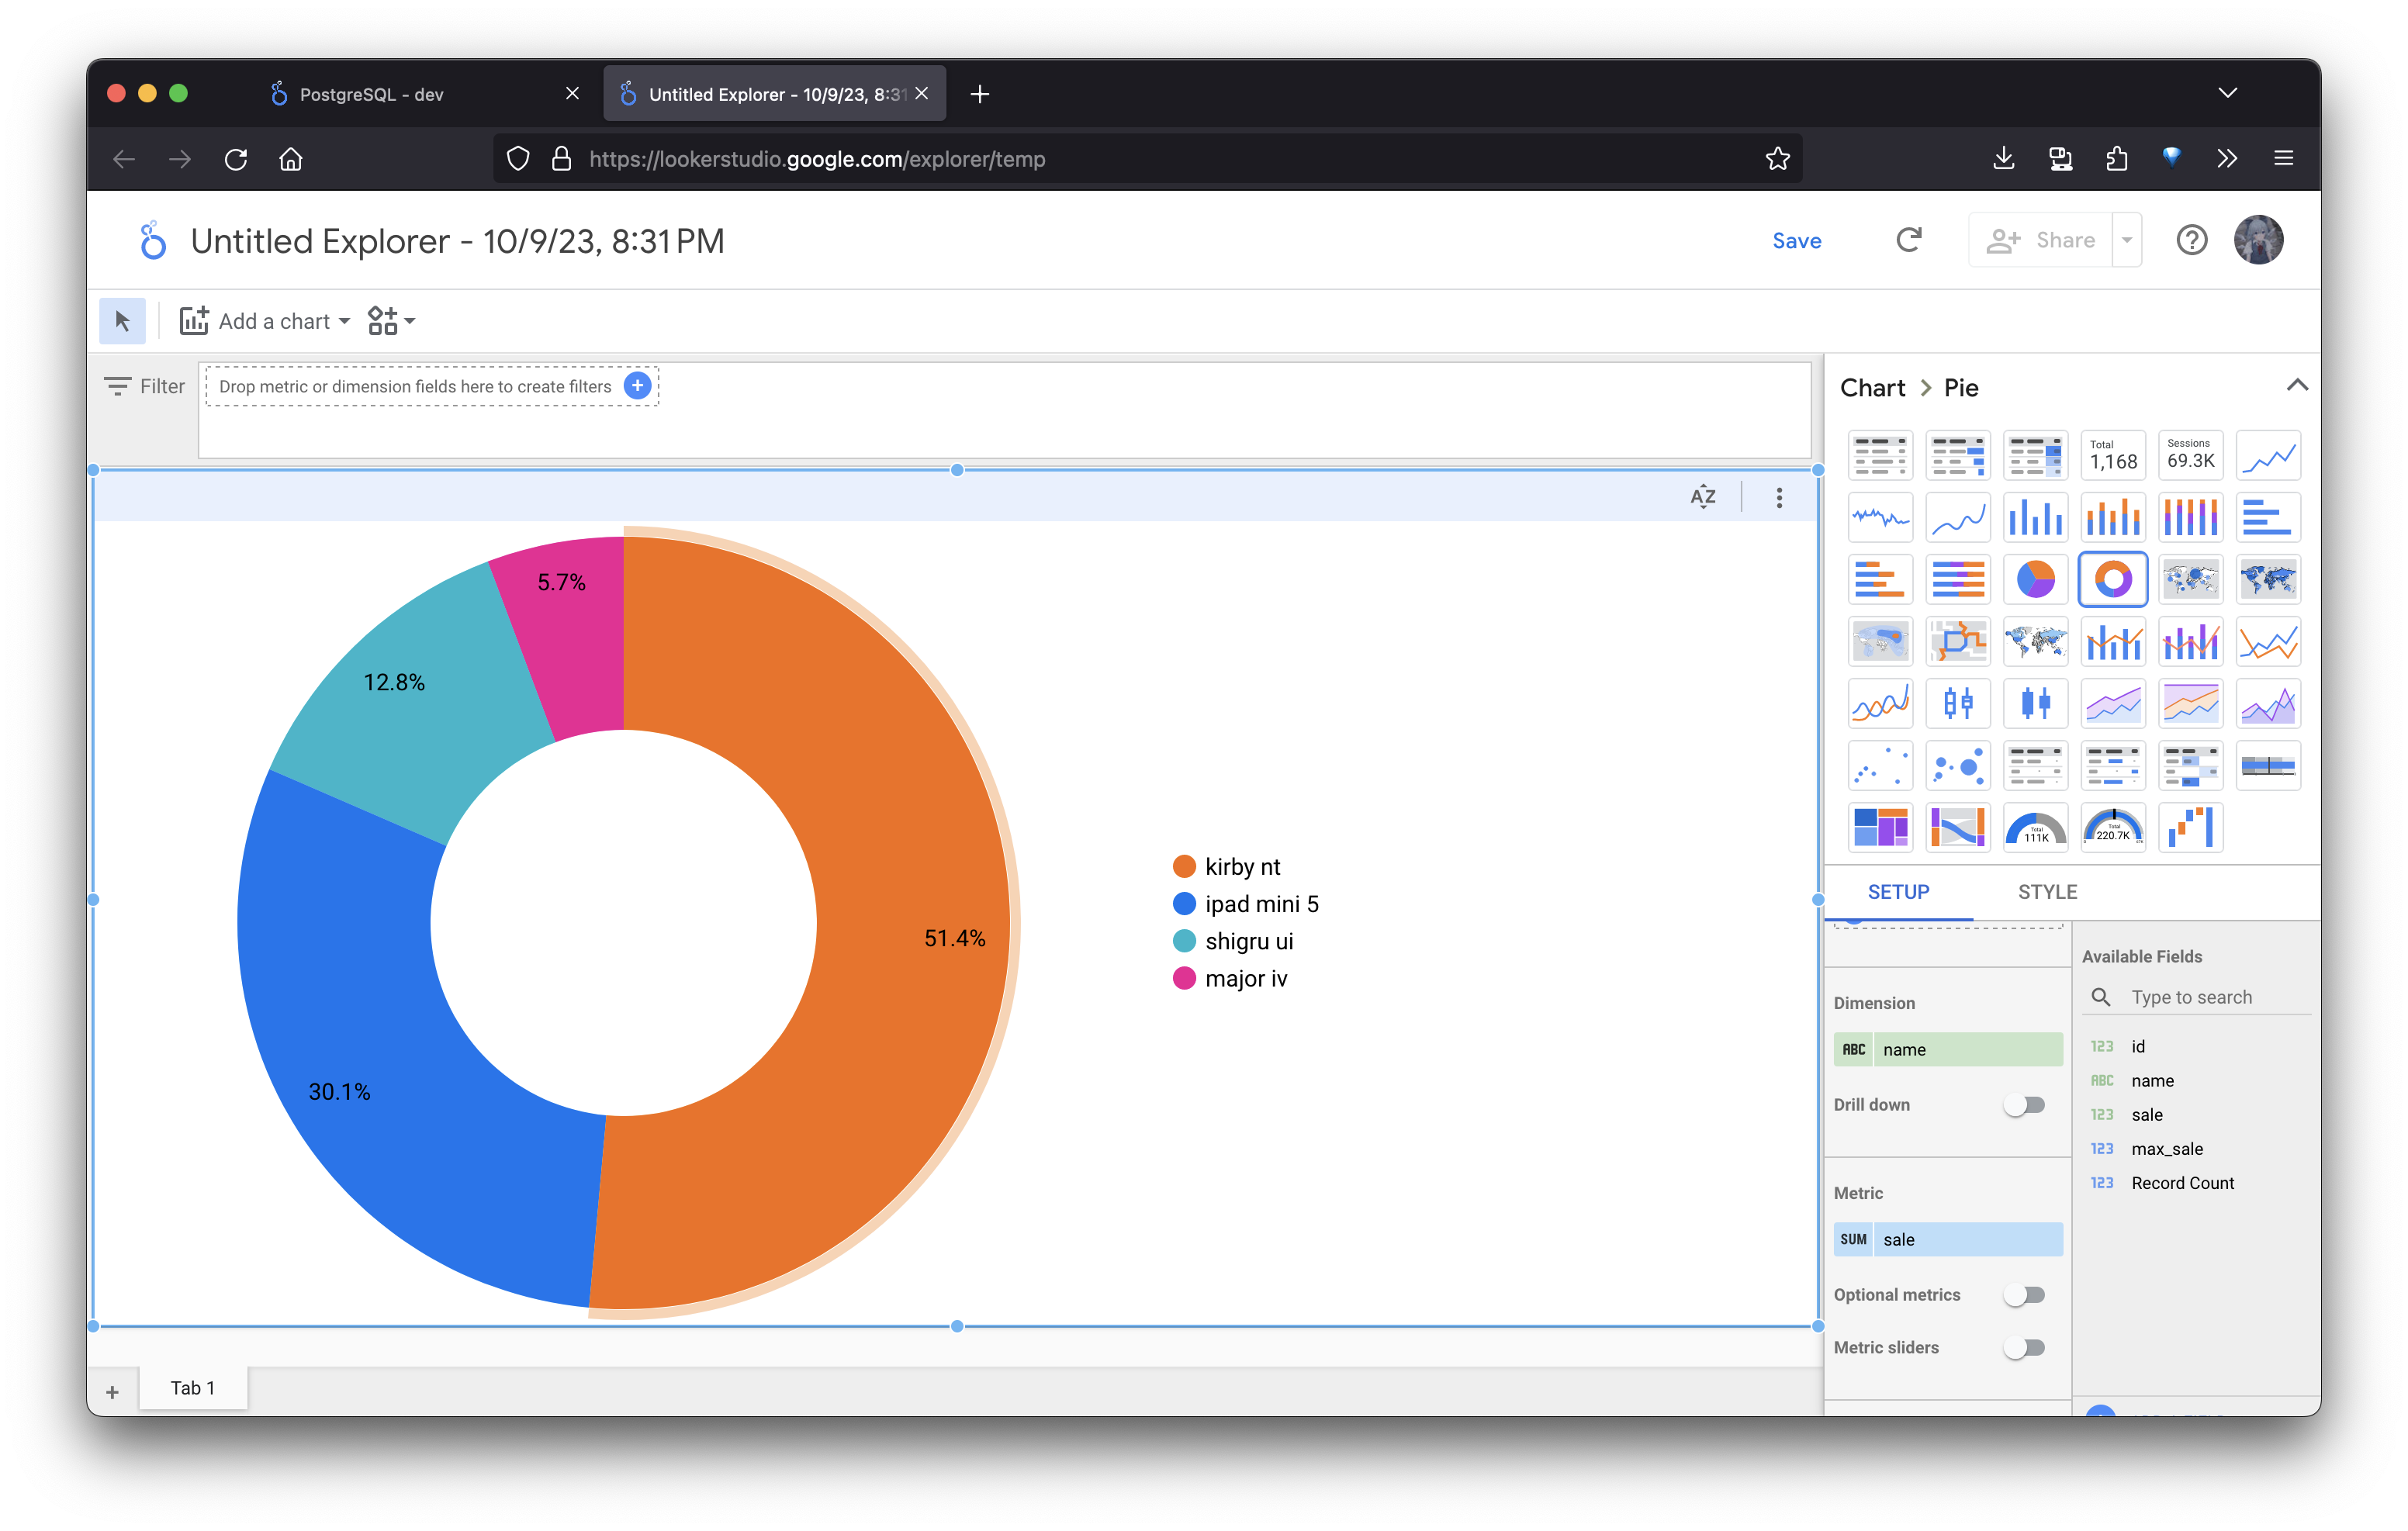
4. Looker will now have access to the databases and tables in RisingWave. You can select the table you need, or fill in the query manually, then click `CONNECT` in the upper right corner. Now you can start building dashboards and charts to explore real-time data.
3. Click `AUTHENTICATE` to confirm the connection is successful.
4. Looker will now have access to the databases and tables in RisingWave. You can select the table you need, or fill in the query manually, then click `CONNECT` in the upper right corner. Now you can start building dashboards and charts to explore real-time data.